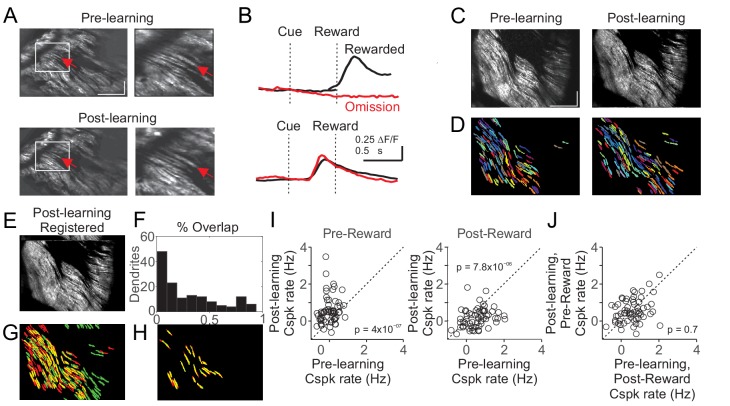
Figure 4. Cspk responses measured in the same fields of view across learning.
(A) Example of manual identification from a field of view containing several of the same PC dendrites on day one and day N+1. Left, fields of view for day 1 (top) and day N+1 (bottom). Right, magnified view from the white box at left. Red arrows indicate an example PC dendrite identified both pre and post learning. Scale bars are 200 μm (x) x 50 μm (y). (B) Cue aligned calcium transients averaged across trials extracted from the PC dendrite identified in (A) for day 1 (top) and day N+1 (bottom). (C) Mean images taken from day 1 (left) and day N+1 (right) after independent rigid motion registration on each dataset. Scale bars are 200 μm (x) x 50 μm (y). (D) Pixel masks of PC dendrites independently extracted from the datasets in (C) (Materials and methods). (E) The post-learning data set from (C) right, was motion registered to the pre-learning dataset from (C) left. The resulting x-y pixel shifts were applied to the post-learning dendrite pixel masks from (D) right. (F,G) Following registration, the overlap between pre and post learning pixel masks was compared quantitatively (F) and graphically (G) with pre-learning masks labeled red, post-learning masks labeled green, and overlap labeled yellow. (H) Dendritic masks from (G) that had >50% overlap. (I) Summary of Cspk firing rates for individual PC dendrites in the pre (left) and post (right) reward window for all dendrites that had a > 50% overlap in their dendritic masks across learning (n = 61). (J) Summary of Cspk rates for the same individual PC dendrites in (I) measured in the post-reward window on Day one and the pre-reward window on Day N+1.

