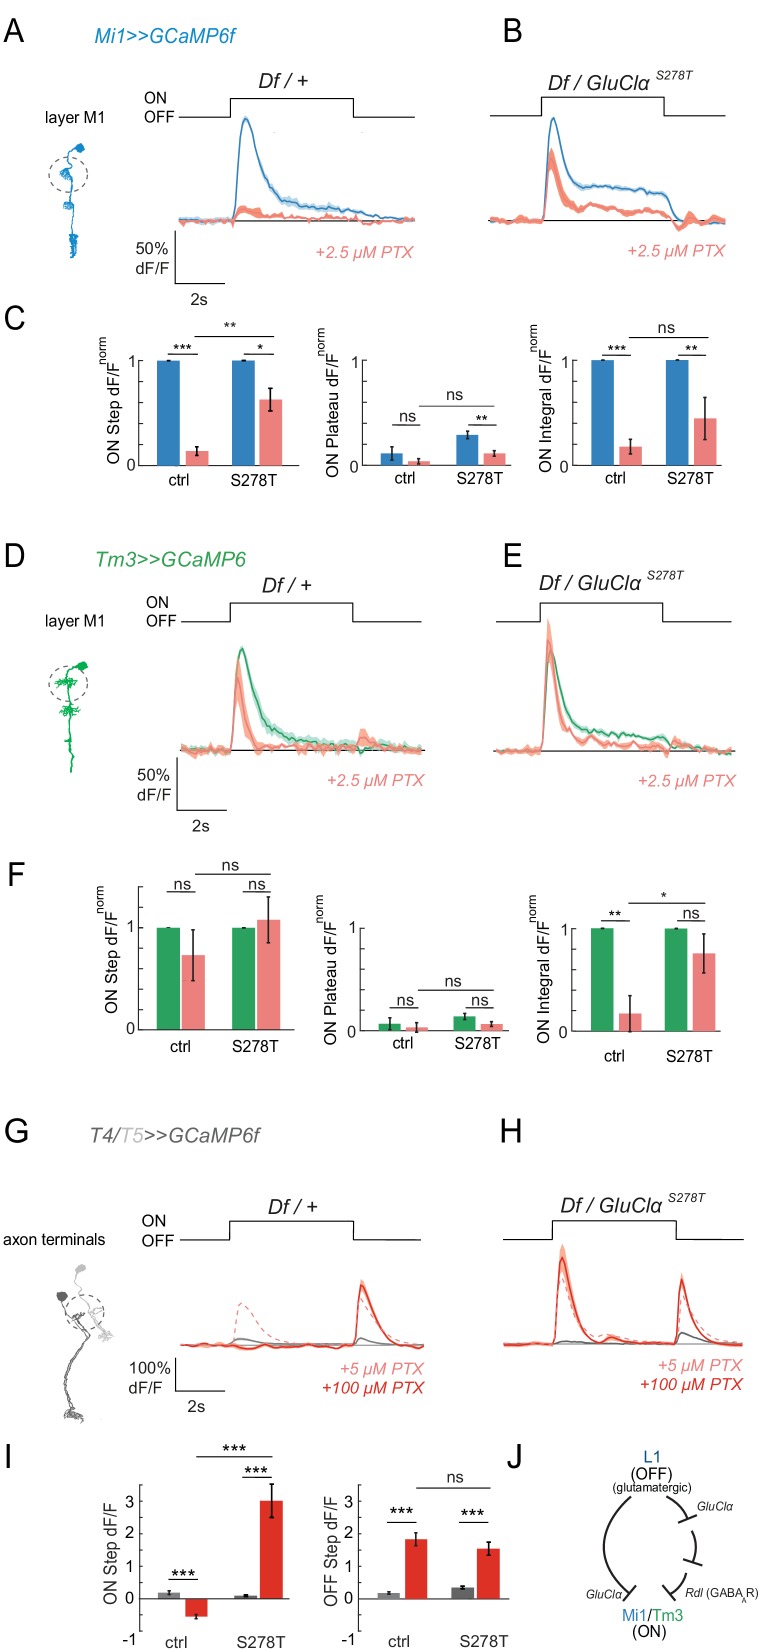
Figure 6. Pharmacogenetics shows that ON responses are mediated by GluClα.
(A,B) In vivo calcium signals in response to full-field flashes recorded in layer M1 of Mi1 neurons. Figure shows traces before (blue) and after (red) 2.5 µM PTX application in heterozygous GluClαDf/+ deficient controls (A, n = 5 [63]), as well as flies only expressing the PTX-insensitive GluClαS278T allele (GluClαS278T/GluClαDf).(B, n = 5 [47]). (C) Bar plots showing the quantification of the data from (A,B). *p<0.05, **p<0.01, ***p<0.001, tested with an unbalanced two-way ANOVA, corrected for multiple comparisons. (D,E) In vivo calcium signals in response to full-field flashes recorded in the layer M1 of Tm3 neurons. Figure shows traces before (green) and after (red) PTX application in heterozygous GluClα Df/+ deficient controls (D, n = 5 [30]), as well as flies only expressing the PTX-insensitive GluClαS278T allele (GluClαS278T/GluClαDf) (E, n = 5 [40]). (F) Bar plots showing the quantification of the data shown in (D,E). *p<0.05, **p<0.01, ***p<0.001, tested with an unbalanced two-way ANOVA, corrected for multiple comparisons. (G,H) In vivo calcium signals in response to full-field flashes recorded in T4/T5 axon terminals. Figure shows traces before (gray) and after (red) 100 µM PTX application in heterozygous GluClα Df/+ deficient controls (G, n = 10[440]), as well as flies only expressing the PTX-insensitive GluClαS278T allele (GluClαS278T/GluClαDf) (H, n = 5[192]). The pink dotted line shows responses after the application of 5 µM PTX. (I) Bar plots showing the quantification of the data shown in (G,H). *p<0.05, **p<0.01, ***p<0.001. Statistics was done using an unbalanced two-way ANOVA, corrected for multiple comparisons. All traces show mean ± SEM. Sample sizes are given as number of flies (number of cells). (J) Schematic summarizing the results. Our results provide support for a combinatorial role of glutamatergic and GABAergic inhibition in mediating ON responses. Since GluClα is likely to be the receptor on all neurons postsynaptic to L1, Rdl could function downstream of GluClα.


