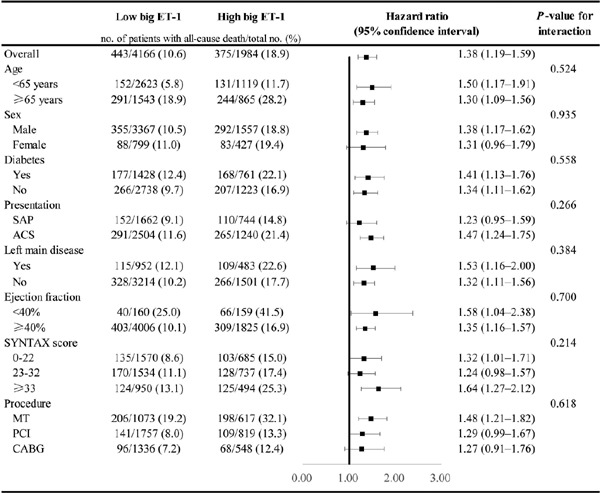
Fig. 3.

Subgroup analyses for the primary endpoint.
HRs and 95% CIs were calculated by reference to the low big ET-1 group. The interaction between big ET-1 level and each covariate was tested by a multivariable Cox proportional hazards regression model.
