Fig. 3.

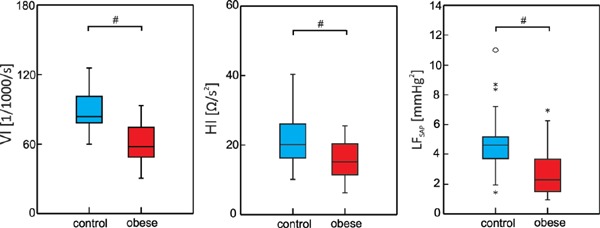
Box plots of VI – Velocity Index; HI – Heather Index; LFSAP – power in low frequency band of spontaneous systolic blood pressure oscillations; circles and asterisks correspond to outliers; # denotes significant between-groups difference

Box plots of VI – Velocity Index; HI – Heather Index; LFSAP – power in low frequency band of spontaneous systolic blood pressure oscillations; circles and asterisks correspond to outliers; # denotes significant between-groups difference