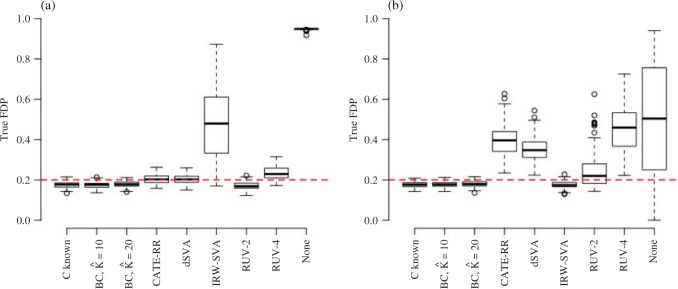
Fig. 1.
The false discovery proportion, FDP, for each method at a  -value threshold of 0.2 in simulations when (a)
  and (b)
  . BC is our shrinkage-corrected method defined in Algorithm 2 and
  is the number of factors used to estimate
  . CATE-RR, dSVA, IRW-SVA, RUV-2 and RUV-4 are the methods proposed in Leek & Storey (2008), Gagnon-Bartsch & Speed (2012), Gagnon-Bartsch et al. (2013), Lee et al. (2017) and Wang et al. (2017), respectively. These five methods were all applied with
  . Inference with None was performed using the design matrix
  .
.

