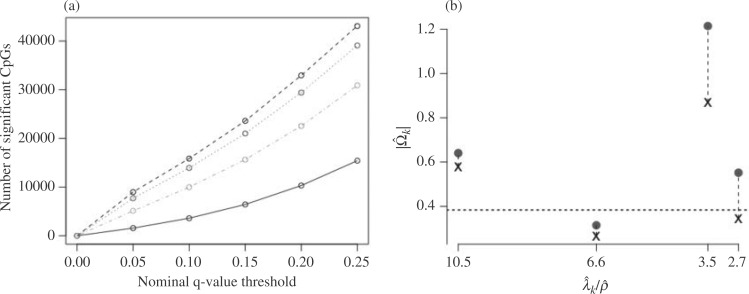
Fig. 2.
Results from our analysis of lung DNA methylation data from Nicodemus-Johnson et al. (2016). (a) The number of asthma-related CpGs at a given  -value cut-off using our shrinkage-corrected estimator (solid line), as well as the estimators proposed in Lee et al. (2017) (dot-dashed line), Wang et al. (2017) (dotted line) and Leek & Storey (2008) (dashed line). (b) The
  components of
  (
( ) and
) and  (
( ) as a function of
  . The dashed line is the 0.95 quantile of the
  distribution, where
  is defined such that
  converges to a chi-squared random variable with
  degrees of freedom under the null hypothesis from Theorem 3.

