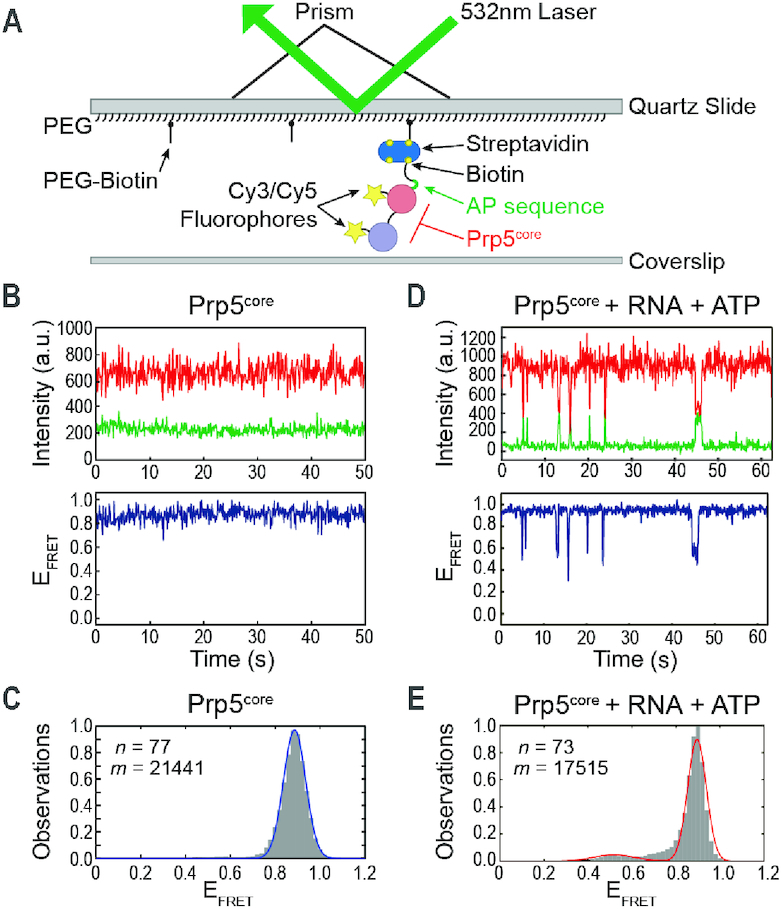
Figure 2.

Conformational Switching of Prp5core Requires ATP and RNA. (A) Schematic of the smFRET assay. (B) Top: Cy3 (green) and Cy5 (red) fluorescence trajectories from a single molecule of Prp5core. Bottom: Calculated EFRET from the shown trajectories. (C) Histogram of EFRET values obtained for Prp5core (grey boxes) and a fit of the data (blue line). (D) Data from a single molecule of Prp5core as in panel (B) except in the presence of poly(A) RNA and ATP. (E) Histogram of EFRET values obtained for Prp5core in the presence of poly(A) RNA and ATP as in panel (C) and a fit of the data (red line). n and m represent the number of individual molecules and EFRET data points, respectively, used to construct the histogram. Data fit results are listed in Supplementary Table S4.
