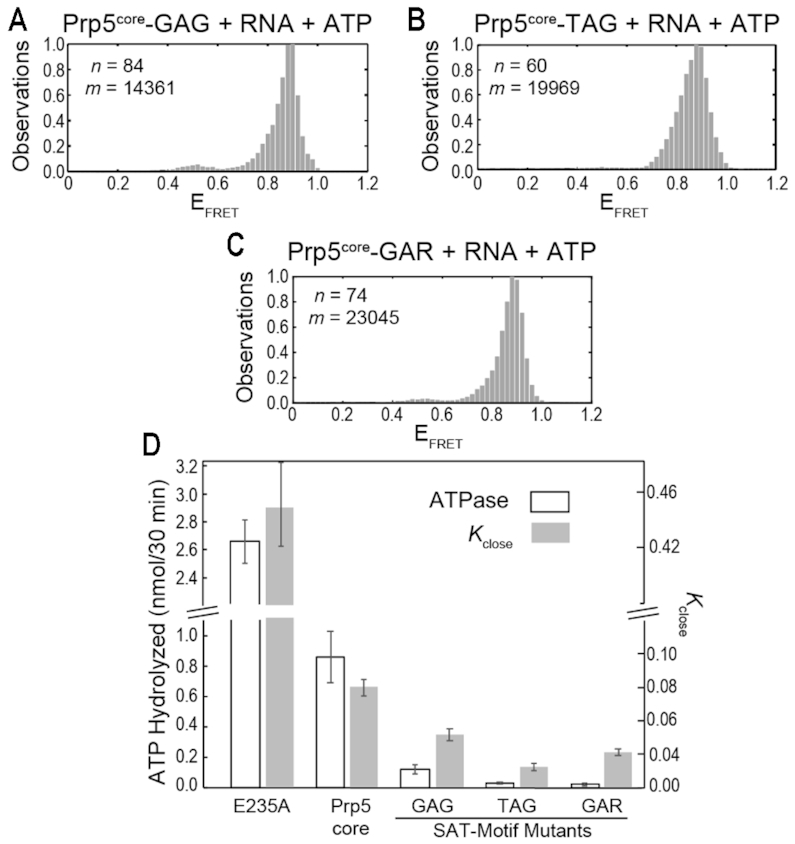
Figure 4.

Impact of E235A and SAT-motif Mutations on Prp5core Dynamics. (A–C) Histograms of EFRET values obtained for Prp5core-GAG (A), -TAG (B) and -GAR (C) in the presence of poly(A) RNA and ATP (gray boxes). n and m represent the number of individual molecules and EFRET data points, respectively, used to construct the histogram. (D) Calculated Kclose values and ATPase rates in the presence of poly(A) RNA obtained for Prp5core and the indicated mutants. Histogram fit results, calculated lifetimes, and Kclose values are listed in Supplementary Table S5. ATPase assays were carried out in triplicate and the shown value represents the average ±SD.
