Figure 1.
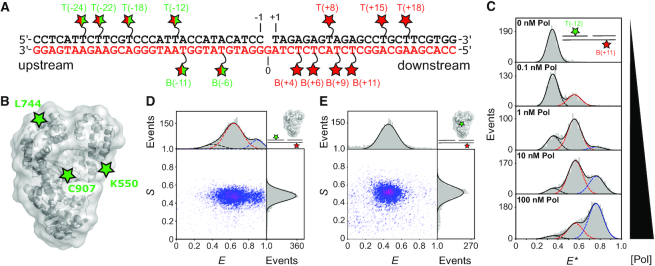
Measuring distances within single polymerase–DNA complexes in heterogeneous mixtures with dynamic species. (A) Schematic of a 1-nt gapped DNA substrate showing the template (red lettering) and non-template strands (black). Red stars represent acceptor labelled dT bases. Split red/green stars indicate positions labelled with donor for DNA–DNA FRET, or acceptor for DNA–protein FRET. (B) DNA Polymerase I (Klenow Fragment; Pol) structural schematic (grey – pdb 1KLN) and donor labelling positions (green stars). (C) Apparent FRET histograms for the doubly-labelled substrate T(–12) B(+11) at increasing concentrations of Pol. The data (grey bars) were fitted with up to three Gaussians (black, red and blue dashed lines), yielding apparent FRET efficiencies, E* of 0.35, 0.55 and 0.75. (D) Corrected ES histogram for a DNA–DNA FRET measurement (here, for T(–12)B(+11) in the presence of 3 nM Pol). Data (grey bars) were fitted by the sum of three Gaussians (solid black lines) centered on E = 0.41 (black dash), E = 0.63 (red dash) and E = 0.90 (blue dash) respectively. (E) Corrected ES histogram for a protein–DNA FRET measurement (here, for C907-Cy3B B6-Atto647N). Data were fitted with a single Gaussian function, centered on E = 0.48. See also Supplementary Figure S1.

