Figure 6.
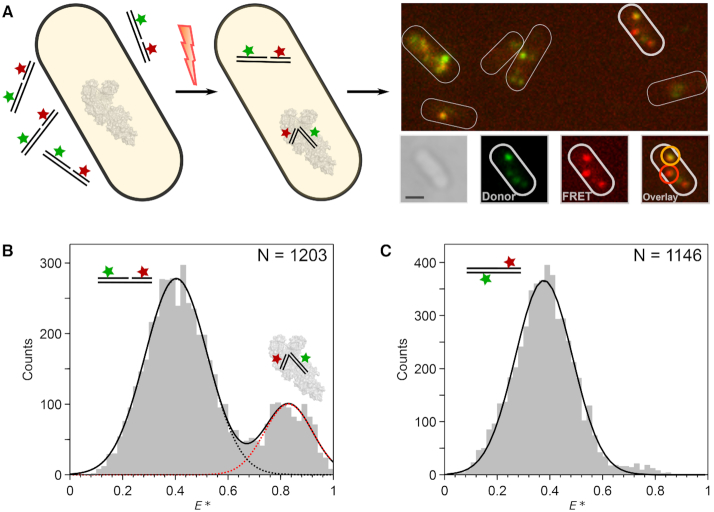
DNA bending detected in live cells. (A) Schematic showing internalization of doubly-labelled gapped DNA fragments into live E. coli using electroporation and single-molecule imaging (left to right). Example cell (bottom right) is shown in white-light image, donor fluorescence channel, FRET fluorescence channel, and latter both combined in overlay image. The overlay image is color-coded such that intermediate-FRET molecules appear orange and high-FRET molecules appear red; two example molecules are highlighted accordingly. Scale bar: 1 μm. (B) FRET histogram of tracked gapped DNA trajectories in vivo. Two major FRET species were observed for the T(–12)T(+8) substrate, which were attributed to unbent DNA (black dots; E* = 0.40) and bent DNA (red dots; E* = 0.83). The number of trajectories (N) is stated for each experiment. (C) FRET histogram of tracked duplex DNA trajectories in vivo. A single low-FRET species, was observed (black, E* = 0.38). See also Supplementary Figure S6.

