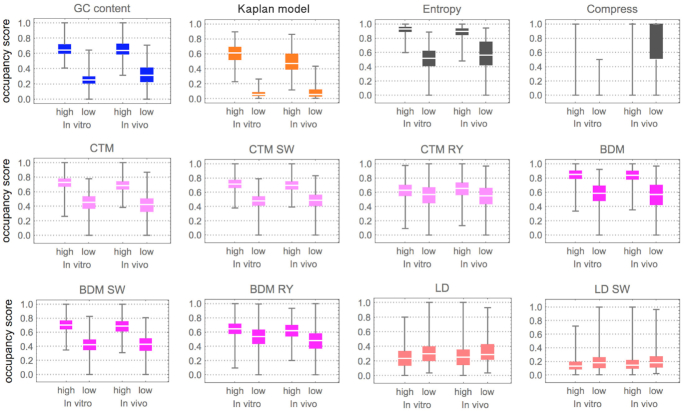
Figure 4.
Box plots of informative indices for top highest and bottom lowest occupancies on Yeast chromosome 14 of 100K bp, representing about 1% of the Yeast genome. The occupancy score is given by a re-scaling function of the complexity value fc (y-axis) where the highest score value is 1 and the lowest 0. In the case of the Kaplan model, fc is the score calculated by the model (7) itself, which retrieves probability values between 0 and 1. Other cases not shown (e.g. entropy rate or Compress on RY or SW) yielded no significant results. Magenta and pink (bright colours) signify measures of algorithmic complexity; the information-theoretic based measures are in dark grey. This segment in chromosome 14 is a randomly chosen sequence for which both in vivo and in vitro nucleosomal positioning values are available, which is likely the reason it is frequently used in the literature. When integrating more regions the errors accumulated due to large gaps of missing values produced results impossible to compare, thereby forcing us to constrain the experiment to this segment.

