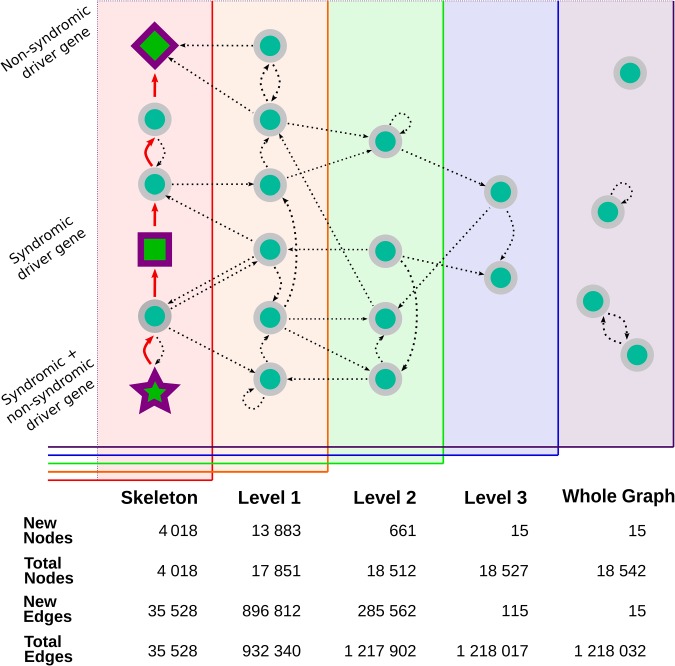
Figure 2.

Visual representation of the expansion of the core interaction graph. The graph builder begins with the construction of the skeleton graph, represented by all the nodes on the leftmost panel. The skeleton is created by finding the shortest direct interaction path (the red arrows) between all the known driver genes—drawn here using the same shapes as in RPGeNet Network Explorer (star, square and diamond shapes, based on whether their mutations cause syndromic diseases or not). The graph is then expanded into level one (represented as the orange panel) by adding all of the parents and children (straight lines) of the nodes already found in the skeleton graph. Level-specific interactions are shown as curved connections linking nodes within a given graph level. The expansion is repeated until the highest level is reached and all known genes with known interactions have been connected to the interactions core graph. The remaining genes that do not have any known interaction that connects them with the core graph are included in the whole graph level. Some of those genes may have interactions with other genes found only in the whole graph level (and many of those interactions are self-references). The bottom table from this figure compares the number of nodes and edges added on each level (‘New Nodes’ and ‘New Edges’ rows), as well as the total number of nodes and edges accumulated.
