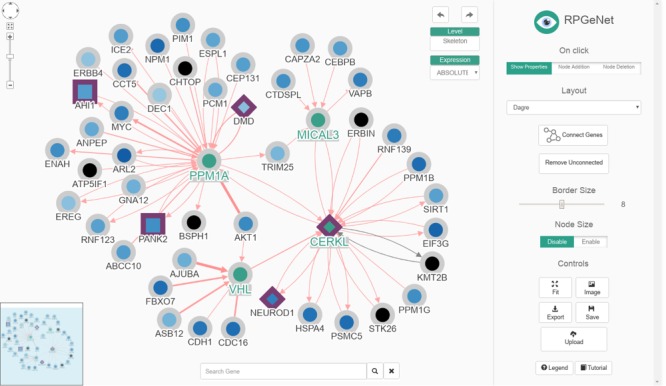
Figure 3.

The renewed Network Explorer interface of RPGeNet. In this example, the Network Explorer interface shows a subgraph containing all the genes that directly interact with CERKL within the skeleton subnetwork, after expanding nodes for PPM1A, VHL and MICAL3 (those selected four nodes highlighted in green, driver genes border in purple, node colors based on the ‘ABSOLUTE’ gene-expression data). Some improvements to the interface can be appreciated: a ‘search’ gene add-on at the mid-bottom, an expression data set selection drop-down menu at the right-top corner of the network visualization canvas, as well as the ‘undo’/‘redo’ buttons. A more dynamic ‘buttons panel’ on the right facilitates the interaction with the network data. Finally, the coloured-by-type interactions also provide directionality information with arrow heads and have reliability-score proportional widths adjusted to the number of evidences supporting them. This figure can be reproduced on the Network Explorer if users upload the Supplementary File 1.
