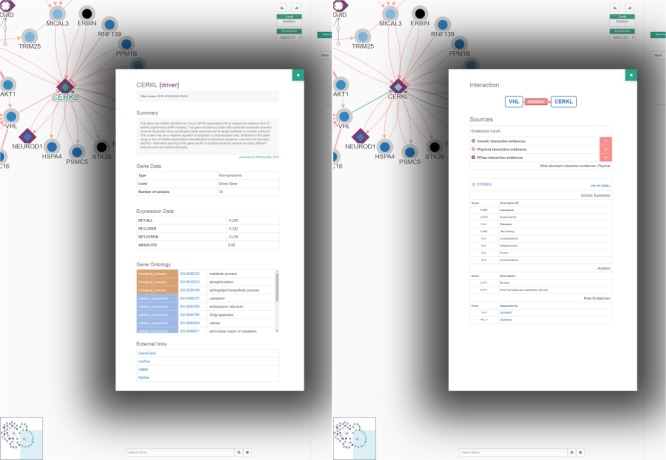
Figure 5.

An example of node (left) and interaction (right) information panels from the Network Explorer interface. The default behaviour ‘On click’ of the Network Explorer interface is to show ‘node properties’ (see topmost controls on the right panel of that interface on previous figure). From the network example of Figure 3, when clicking at the CERKL node the gene/protein information panel pops up to display a description of the gene, known aliases, a summary of its expression levels and functional annotation and links to external references. On the other hand, by clicking on an edge, VHL to CERKL in this example, the interaction panel pops up, providing information about the type of possible interactions (genetic, blue; physical, red; or ‘unknown’, black), as well as a series of tables containing details about the supporting evidences from the distinct sources, along with the corresponding external links to the reference databases and to the supporting evidences when possible.
