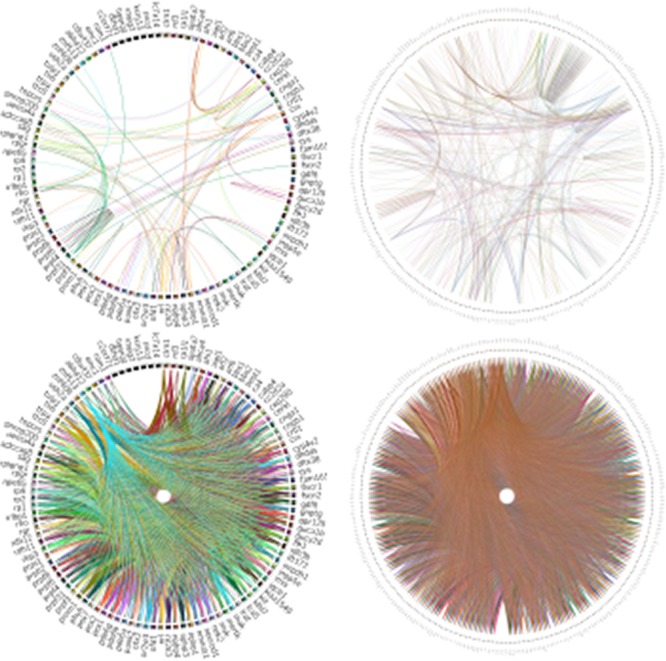
Figure 6.

Analysis of RPGeNet v1 and v2 networks connectivity with Circos (19). The figure compares the connectivity of the driver genes of the old RPGeNet v1.0 (left) and the updated RPGeNet v2.0 (right). The top pair of the plots shows all the shortest paths between driver genes at distance one, meaning direct interaction between each pair of driver genes. The bottom part of the plots provide the comparison at distance three, meaning there are two genes in the shortest path between a pair of driver genes of interest. It is clear from the visualized Circos plots that the updated RPGeNet database has a highly connected network.
