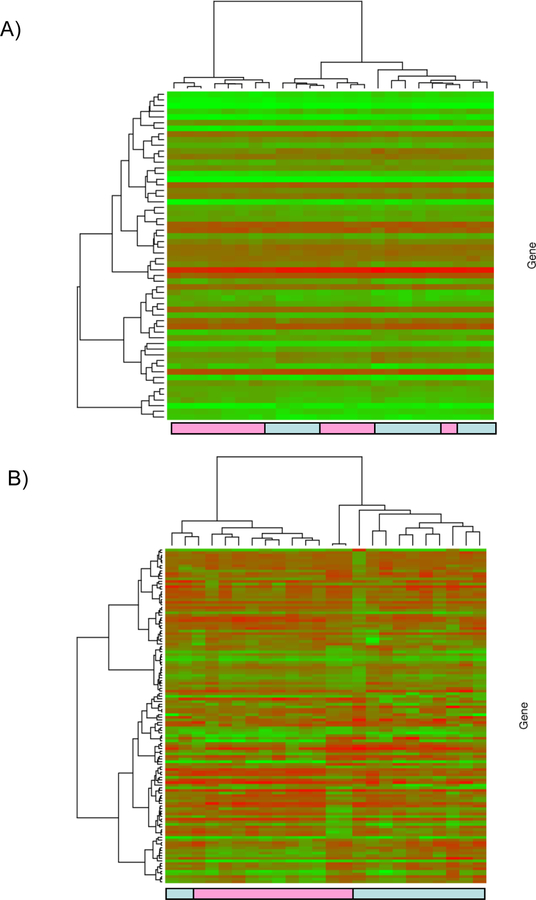
Figure 1: Supervised cluster analysis.
The gene expression dataset was restricted to the 58 significant probe sets. Hierarchical clustering Ward’s method and 1-|ρ| as the distance measure where ρ is Pearson’s correlation was applied. The heatmap and associated dendograms were plotted as a graphical representation of the significant genes (Figure 1A). Unsupervised cluster analysis. the gene expression data were first filtered by retaining only probe sets called present across all arrays and having a standard deviation in the 90th percentile or greater. Hierarchical clustering Ward’s method and 1-|ρ| as the distance measure where ρ is Pearson’s correlation was applied. The heatmap and associated dendograms for the unsupervised clustering appear in Figure 1 B. Light blue boxes: HCV (+) donor kidney samples, Pink boxes: HCV (–) donor samples.

