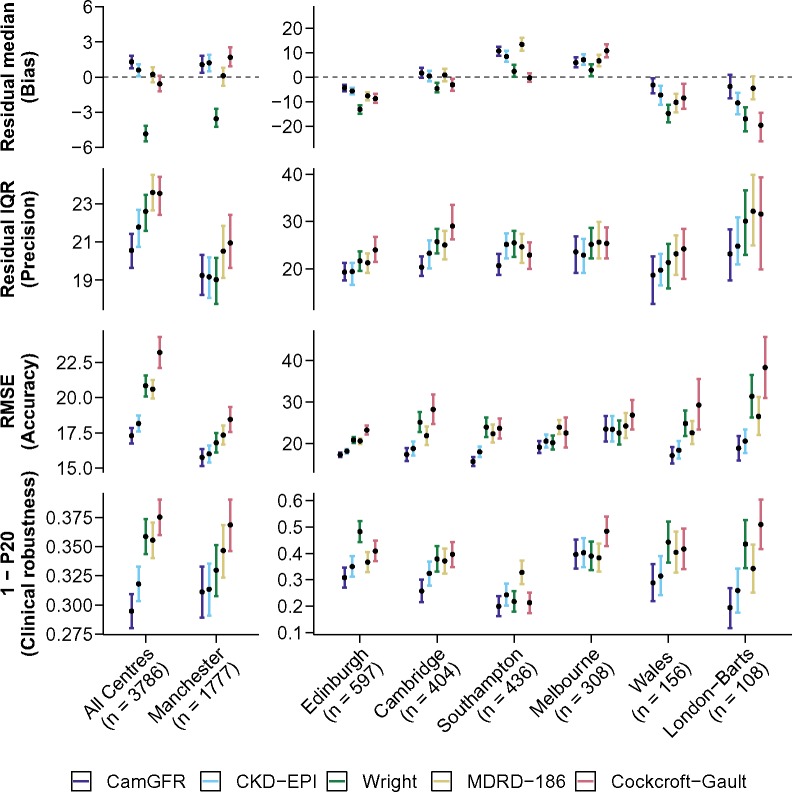
Figure 1.
Performance analysis of commonly used and well-performing models. Results for the five best-performing models (CamGFR, CKD-EPI, Wright, MDRD-186, and Cockcroft-Gault) for the 3776 patients from the non-IDMS–creatinine validation dataset are displayed. Performance analysis of the other models is included in Supplementary Table S5 (available online). A pooled analysis of data from all centers and the individual center analyses are shown (first row). The residual (measured GFR–estimated GFR) median, which is a measure of a model’s bias, is displayed (second row). The residual interquartile range (IQR), which is a measure of a model’s precision, is displayed (third row). The RMSE, which is a measure of a model’s accuracy, is displayed. Accuracy is a combination metric of bias and precision (fourth row). The proportion of patients who have an absolute percentage error more than 20% (1-P20), which reflects clinical robustness by illustrating the proportion of patients with a clinically relevant error, is displayed. The best results are closest to zero for the residual median and the smallest value for IQR, RMSE, and 1-P20. All error bars are 95% confidence intervals calculated using bootstrap resampling with 2000 repetitions and a normal distribution approximation. CKD-EPI = Chronic Kidney Disease Epidemiology Collaboration; IDMS = isotope dilution mass spectrometry; MDRD-186 = Modification of Diet in Renal Disease version 186; RMSE = root-mean-squared error.

