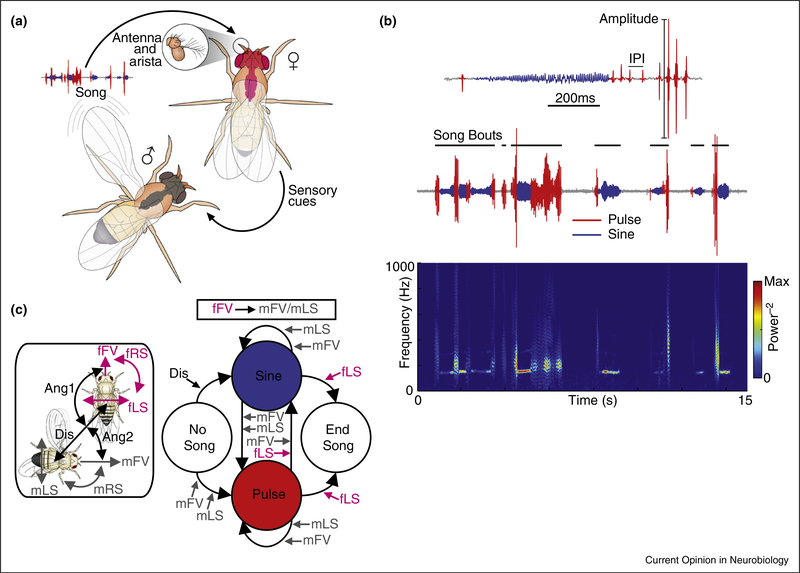
Figure 1.
(a) Schematic of Drosophila melanogaster acoustic communication. Central nervous systems are indicated in gray (male) and magenta (female) shading. (b) 15s example of fly song (middle) segmented into pulse (red) and sine (blue) modes (song bout structure is indicated), with accompanying spectrogram (bottom). A short song excerpt (top) highlights pulse amplitude and inter-pulse interval (IPI). (c) Left, schematic of fly movement features. Right, summary of the influence of movement features on song bout patterning, as revealed by GLM analysis. Modified with permission from [15••].

