Figure 1.
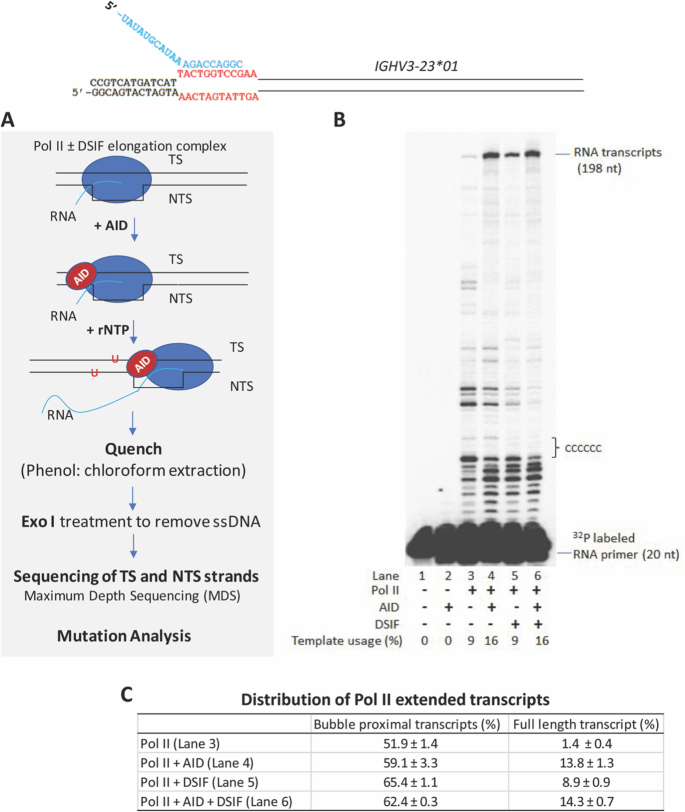
Experimental protocol used to analyze AID-catalyzed dC deamination on IGHV3-23*01 during transcription by human Pol II. (A) Pol II ± DSIF elongation complexes were assembled on a DNA–RNA ‘scaffolded bubble’ substrate and preincubated with AID. Transcription was initiated by the addition rNTP substrates, and the elongation reaction was performed at 30°C (Methods). Following transcription, Exonuclease I (Exo I) was added to digest ssDNA. TS and NTS DNAs were separately barcoded and subjected next-generation sequencing analysis using Maximum Depth Sequencing (MDS) (39) to assess AID-mediated dC deamination. (B) Transcription in the presence of AID and DSIF was visualized as 32P-labeled RNA primer elongation bands that extend for the full length of the IgV DNA (198 nt). A strong transcription pause region is located ∼11 nt downstream of the scaffold bubble, and is followed by six C residues on the TS, in which deaminations are observed to occur at as many as three contiguous C sites – see also Supplemental Figure S9. (C) Distribution of Pol II extended transcripts. Percentage (mean ± standard deviation) of scaffold bubble proximal transcripts (1–12 nt from the end of the scaffold bubble to a run of six consecutive Cs) and full-length transcript (198 nt) were quantified by GE Healthcare ImageQuant software. A sketch depicting the transcribed IgV substrate and the scaffold bubble containing a 20 nt RNA primer strand is shown at the top.

