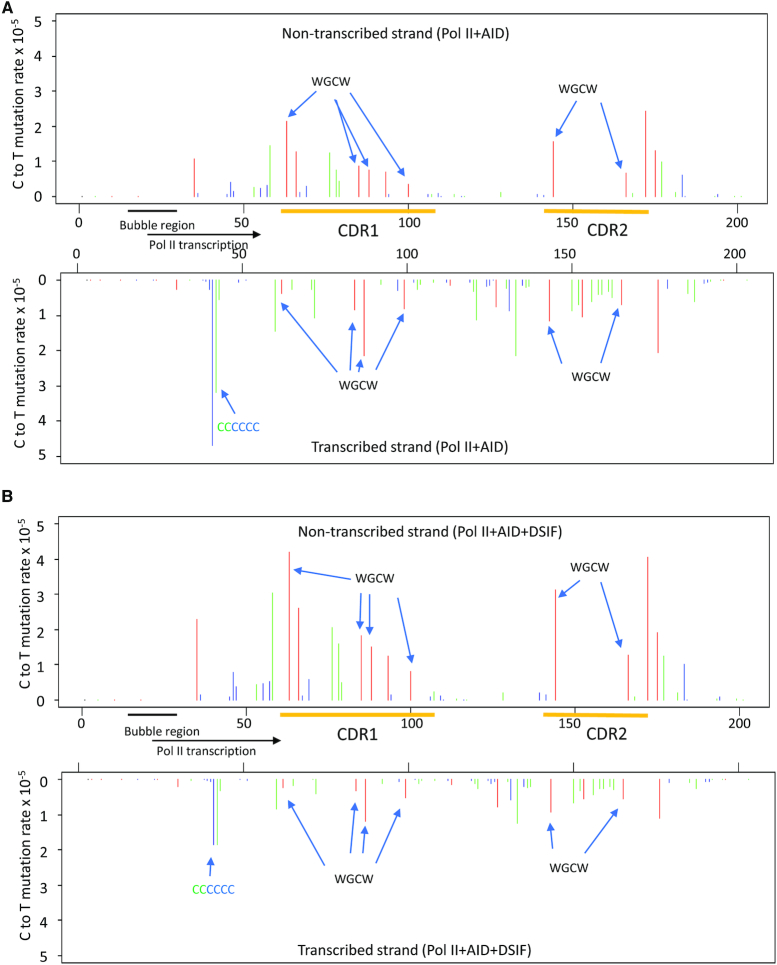
Figure 2.
AID-catalyzed dC NTS and TS deamination spectra on IGHV3-23*01. (A) AID deamination spectra for the NTS (top) and TS (bottom) during transcription of IgV DNA by Pol II. Deaminations are detected as C → T mutations at C template sites determined by MDS sequencing. The C → T mutation rate is shown at each dC site in the IgV target sequence (5′WRC hot-motifs, red bars, 5′SYC cold-motifs, blue bars; all other motifs containing a C site, green bars). The mutation rate at each site on NTS or TS was calculated as numbers of scored C to T mutations divided by total numbers of all sequenced Cs at a given position. (B) AID deamination spectra for the NTS (top) and TS (bottom) strands during transcription of IgV DNA by Pol II + DSIF. In A and B, preferred overlapping hot motifs (WGCW) in IGHV3-23*01 CDR1 and CDR2 regions in NTS and TS, and a six consecutive CCCCCC site on the TS, are indicated by arrows.

