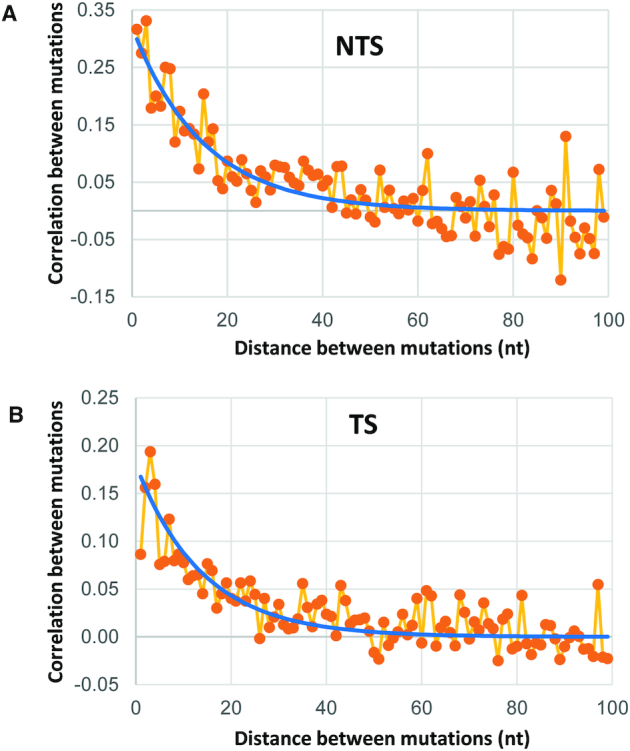
Figure 4.

Analysis of mutation correlation in clones with two or more mutations on NTS (A) and TS (B) strands. Plots show correlation between mutations as a function of sequence separation between them on clones with more than one mutation. Exponential models (blue lines) reveal approximate correlation lengths of 15 for NTS and 14 for TS.
