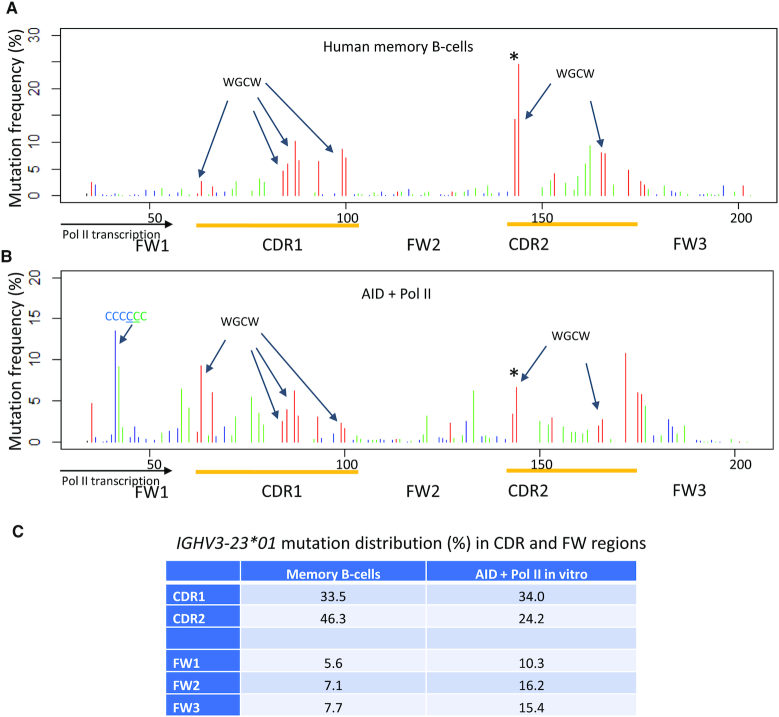
Figure 5.
Distribution of C/G mutations from mutated non-productive human IGHV3-23*01 in memory B-cells in vivo (A) and Pol II-driven AID deamination in vitro (B). In vivo mutations were extracted from the memory B-cells database, and in vitro C:G mutations on Pol II-transcribed IGHV3-23*01 were compiled from C to T mutations on both NTS and TS strands (Figure 2A). The x-axis shows base positions within IGHV3-23*01 with designated FWs and CDR regions (yellow). The mutation frequency (%) is shown at each C or G site in the target sequence: 5′-WRC (GYW-3′) hot-motifs, red bars; 5′-SYC (GRS-3′) cold-motifs, blue bars; all other motifs contain a C or G site, green bars. Mutation frequency is defined as % of mutations occurring at the indicated position on TS or NTS relative to the total number of mutations found on TS or NTS. Preferred overlapping hot motifs (WGCW) in IGHV3-23*01 CDR1 and CDR2 regions in NTS and TS, and a six consecutive CCCCCC site on the TS, are indicated by arrows. An asterisk (*) above the first WGCW motif in CDR2 indicates the AGCT overlapping site that dominates the mutation spectra in memory B-cells. (C) Distribution of mutations (%) in CDR and FW regions of IGHV3-23*01. Mutations from six consecutive C sites were excluded for AID + Pol II in vitro due to frequent Pol II pausing located immediately downstream from the scaffold bubble.

