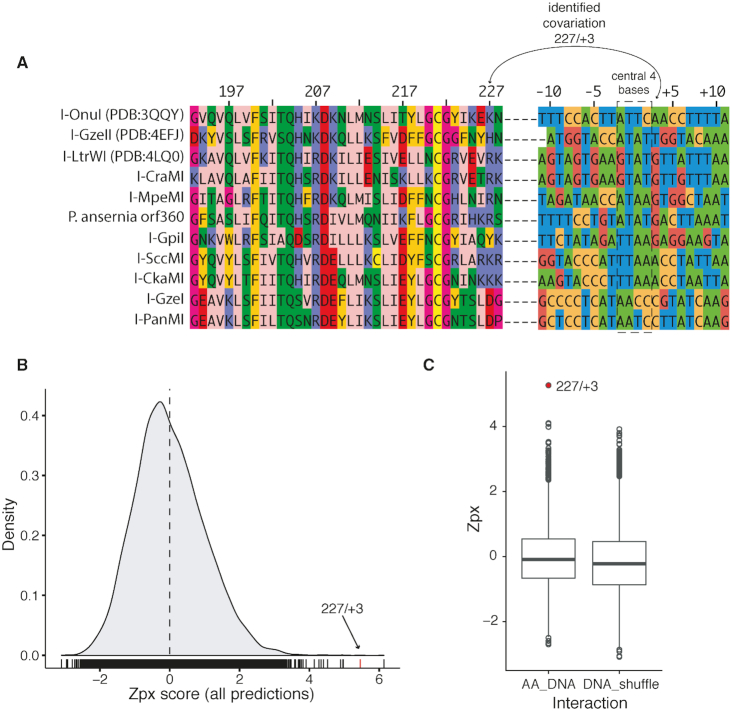
Figure 2.
Evolutionary-normalized MI predictions of protein–DNA co-variation. (A) A portion of the multiple sequence alignment used in the MI analyses. Shown are aligned residues 193–228 of 11 characterized meganucleases with their mapped DNA substrates concatenated to the end of each sequence (the full alignment is provided in Supplementary File S1). The central 4 bases of each target site is indicated by a dashed rectangle. The residue pair 227/+3 identified by MI is indicated by solid line. Amino acid residues are colored by using the Zappo color scheme of JalView using physicochemical properties. DNA target sites are colored by nucleotide. All numbering is relative to I-OnuI (3QQY). (B) Density plot of Zpx scores from MI analyses of the LHE-DNA alignment. The dotted vertical line represents the mean Zpx value. The Zpx score for the 227/+3 pair is indicated by an arrow and red vertical line. (C) Boxplots of Zpx scores binned by amino acid-DNA contacts (AA_DNA) and scores for the 227/+3 pair from 10 000 MI analyses with randomly shuffled DNA sequences (DNA_shuffle).

