
Figure 3.
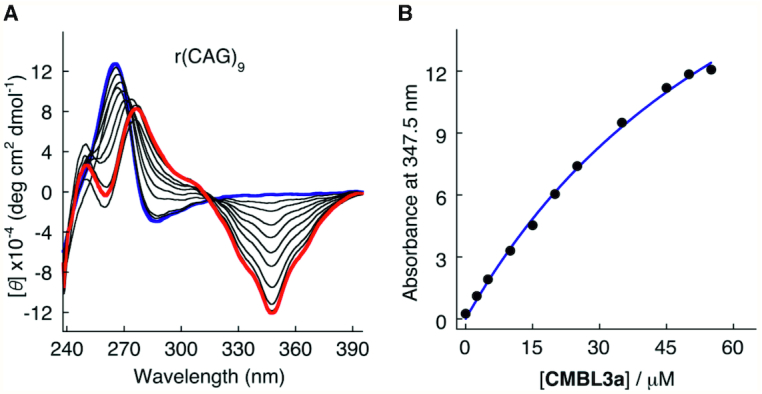
Biochemical analysis of CMBL3a interacting with CAG RNA repeats using circular dichroism. (A) CD spectra. (B) Ellipticity at 347.5 nm obtained from titration data were plotted against the CMBL3a concentration.
Official websites use .gov
A
.gov website belongs to an official
government organization in the United States.
Secure .gov websites use HTTPS
A lock (
) or https:// means you've safely
connected to the .gov website. Share sensitive
information only on official, secure websites.
Biochemical analysis of CMBL3a interacting with CAG RNA repeats using circular dichroism. (A) CD spectra. (B) Ellipticity at 347.5 nm obtained from titration data were plotted against the CMBL3a concentration.