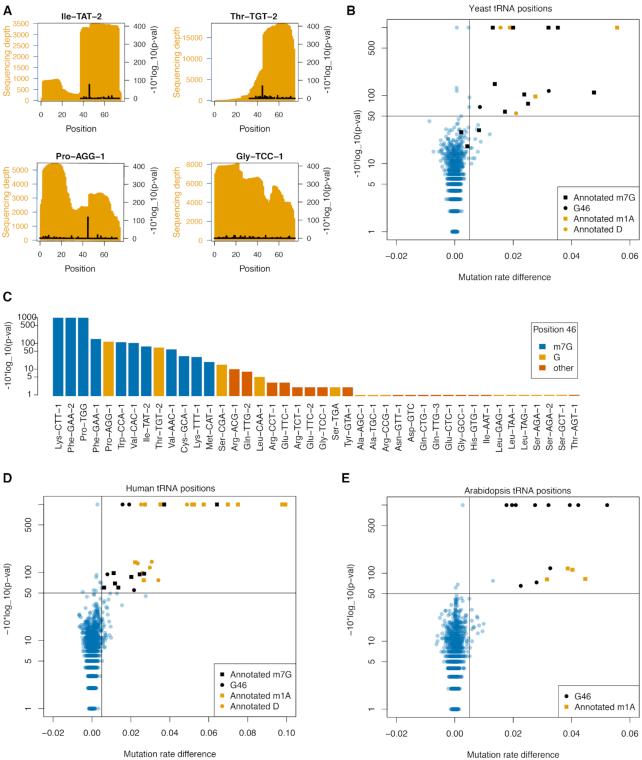
Figure 3.
(A) Sequencing depth and m7G-MaP-seq -10*log_10(p-val) for selected yeast tRNA. (B) Mutation rate difference versus -10*log_10(P-val) plot of all detected yeast tRNA positions. Known m7G positions are specifically detected by m7G-MaP-seq. (C) m7G-MaP-seq -10*log_10(p-val) for yeast tRNA positions aligning to position 46 in the tRNA variable loop. (D) Mutation rate difference vs -10*log(p-val) plot of all detected human tRNA positions. (E) Mutation rate difference vs -10*log_10(p-val) plot of all detected arabidopsis tRNA positions.

