Figure 5.
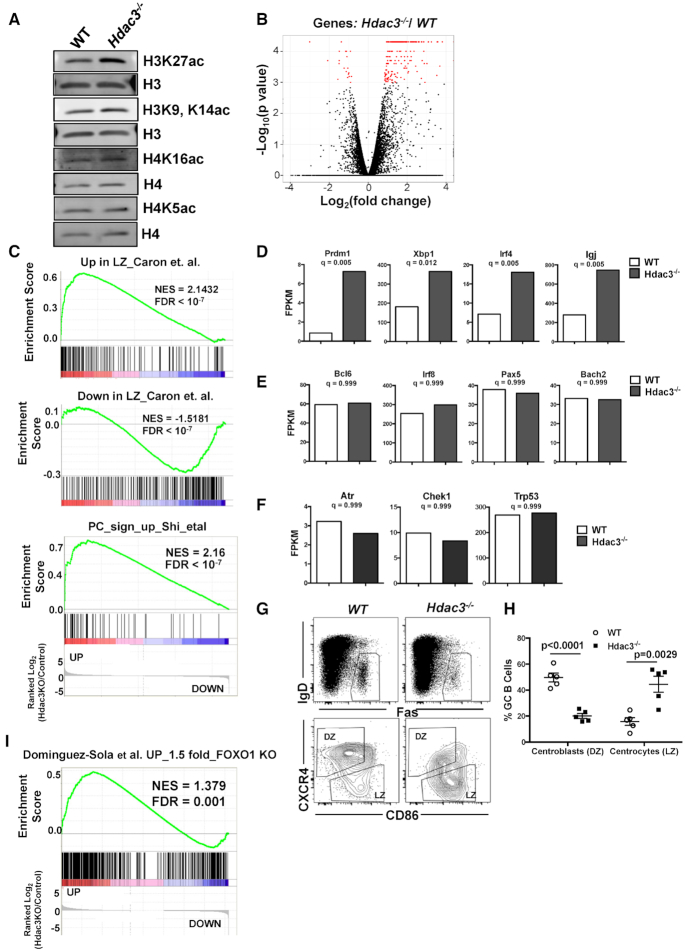
Hdac3 loss is associated with a reduction in dark zone centroblasts. (A) Western blot analysis detecting acetylated histone marks from B220+ splenocytes isolated from Hdac3−/− animals or WT controls. (B) Spleens from SRBC-injected mice were sorted for germinal center B cells (B220+GL7hi). The volcano plot depicts genes with significantly altered expression in Hdac3-deleted cell populations in red. (C) GSEA was performed comparing gene expression changes in Hdac3−/− germinal center B cells to a published signature of genes upregulated in light zones compared to dark zones (75) (upper), genes down-regulated in light zones compared with dark zones (75) (middle) and a signature of the 50 most up-regulated transcripts in differentiating plasma cells (76). (D) Transcript levels of key regulators of plasma cell differentiation (Prdm1, Irf4, Xbp1, IgJ) were significantly up-regulated upon Hdac3 loss in germinal center B cells. (E) Transcripts associated with germinal center B cell indentity (Bcl6, Irf8, Pax5, and Bach2) were unaltered in the absence of Hdac3. (F) Canonical Bcl6 targets associated with DNA damage checkpoints (Atr, Chek1 and Trp53) were unchanged in Hdac3−/−germinal center B cells. (G) B220+IgDloFas+ GC B cells (upper) were further classified as dark zone centroblasts or light zone centrocytes on the bases of surface CXCR4 and CD86 expression. (H) Quantification of populations identified in (A) from 5 mice/genotype. (I) GSEA identifies a significant correlation between genes up-regulated in GC B cells upon loss of Hdac3 and genes up-regulated upon loss of Foxo1 (17).

