Figure 6.
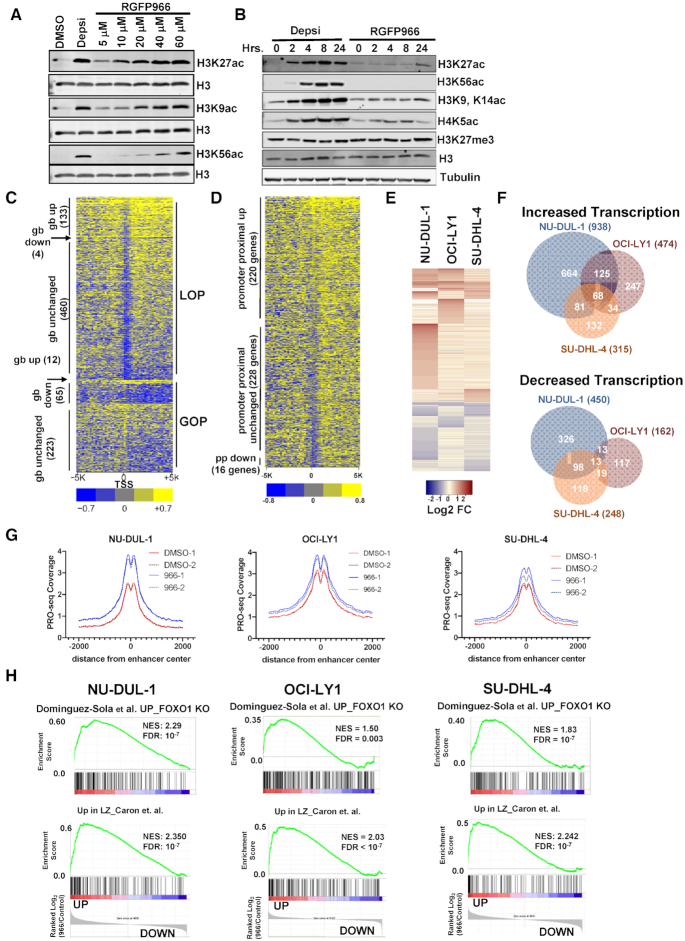
PRO-seq analysis of lymphoma cells treated with an Hdac3-selective inhibitor. (A) Western blot analysis of acetyl-histone H3K27, H3K9 and H3K56 using anti-Histone H3 as a loading control 24 h after addition of 10 nM Depsipeptide or RGFP966 at the concentration shown at the top of each lane. (B) Western blot shows accumulation of histone acetylation over time in response to either 10 nM Depsipeptide or 10 μM RGFP966. (C) Heat map displaying the relative intensity of active RNA polymerases ±5 kb from the transcriptional start site (TSS) of genes affected by a 3 h treatment of OCI-LY1 cells with 10 uM of RGFP966. LOP, loss of promoter-proximal pausing; GOP, gain of pausing; gb, gene body. (D) Heat map as described in B, but showing genes with increased polymerase in the gene body. (E) Heat map showing the changes up and down for genes affected by a 3 h treatment of RGFP966 of the lymphoma cell lines indicated at the top of each lane. (F) Venn diagrams show the number of genes whose transcription was commonly increased or decreased in PRO-seq data from the three lymphoma cell lines treated with RGFP966 for 3 h in cell lines shown. (G) PRO-seq signal corresponding to eRNA levels around NRSA-called intergenic enhancers following a 3-hour treatment with RGFP966 (H) Gene set enrichment analysis comparing gene changes identified by PRO-seq following HDAC3 inhibition with RGFP66 with the FOXO1 gene signature (upper) or a light zone gene signature (lower) for all three DLBCL cell lines.

