Figure 7.
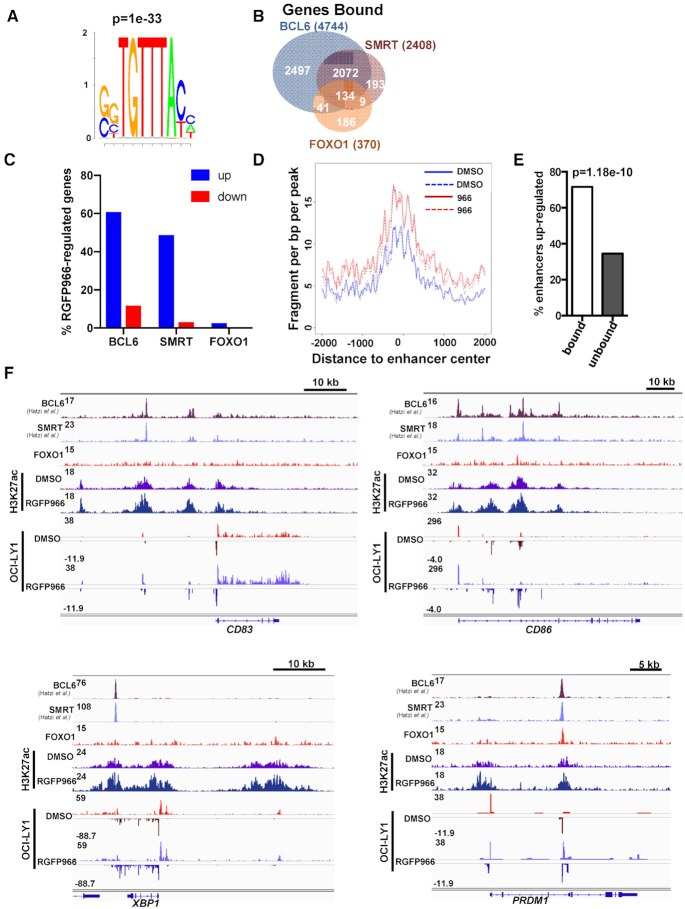
Hdac3 associates with and regulates a subset of BCL6/Foxo1 gene targets. (A) ChIP-exo was performed from OCI-LY1 cells using α-FOXO1. Motif analysis of called FOXO1 peaks revealed a highly significant enrichment for the forkhead DNA binding motif. (B) FOXO1 peaks were annotated to nearest gene and compared with BCL6- and SMRT-bound genes. FOXO1 peaks obtained were compared with published ChIP-seq data for BCL6 and SMRT from the same cell line (9). (C) BCL6, SMRT or FOXO1 bound genes were compared with genes identified as either up-regulated or down-regulated by PRO-seq following HDAC3 inhibition. The percentage of genes bound by the respective transcription factor is shown. (D) The histogram depicts changes in the activity at enhancers located within 100 bp of a BCL6:SMRT binding site following treatment with RGFP966. (E) Graph shows enhancers bound by BCL6:SMRT complexes were more likely to be up-regulated upon HDAC3 inhibition than non-bound enhancers (P value determined by Fisher's exact test). (F) Loci associated with Light Zone centrocytes (CD83, CD86) and plasma cell differentiation (XBP1, PRDM1) are displayed. Tracks depict BCL6, SMRT and FOXO1 ChIP signal as well as ChIP for H3K27ac ± 10 μM RGFP966 for 3 h and PRO-seq signal +/− 10μM RGFP966 for 3 h.

