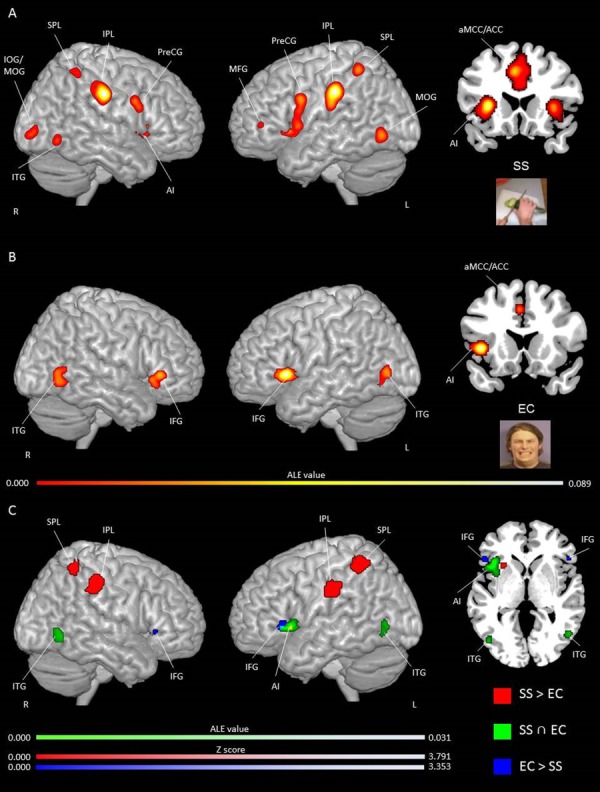
Fig. 3.

Activation likelihood clusters for pain empathy experiments using SS or EC visual pain information during a pain > no pain condition. Regions consistently, distinctively and commonly activated during SS and EC visual pain information. (A) ALE single map for SS (n = 53) in three-dimensional and coronal (y = 22) view. See Table S1 for peak coordinates and ALE values. (B) ALE single map for EC (n = 25) in three-dimensional and coronal views (y = 16). See Table S2 for peak coordinates and ALE values. (C) Regions commonly and distinctly activated during SS and EC resulting from conjunction and subtraction analyses. ALE clusters specifically related to SS in red and to EC in blue, and commonly activated in green in three-dimensional and axial (z = 1) views. ALE maps are superimposed on the template brain ch2better.nii.gz in MNI coordinate space using MRIcron software. Thresholds: cluster-forming P-uncorrected <0.001 and cluster-level inference <0.05.
