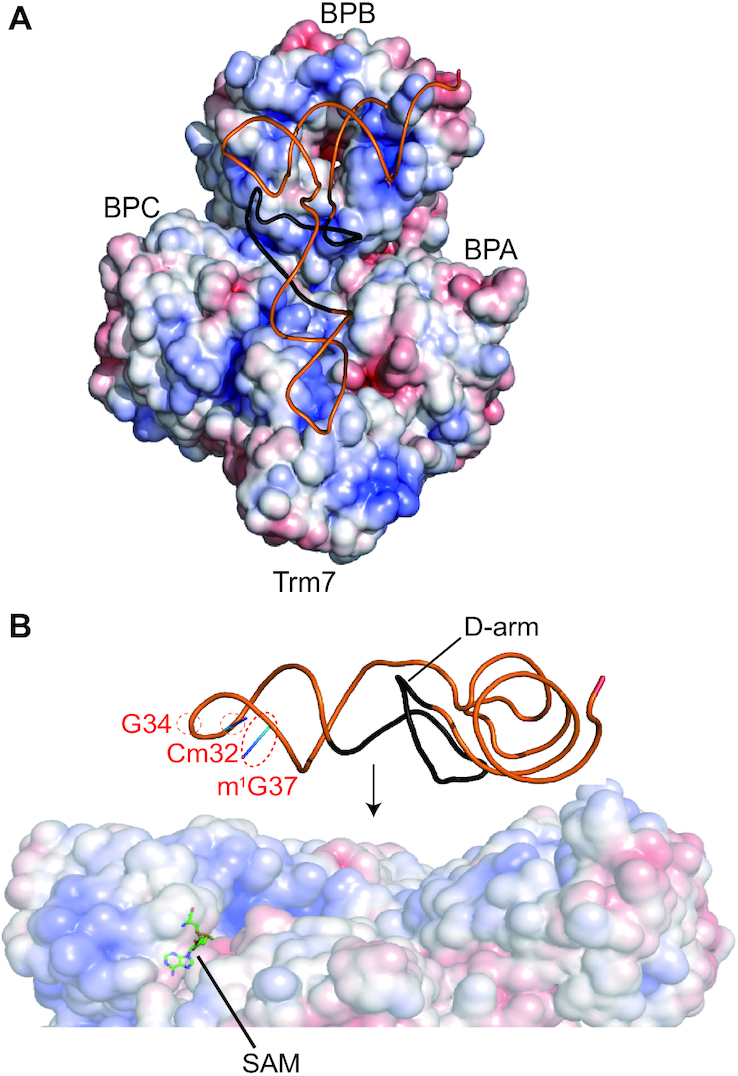
Figure 6.

Search for the RNA-binding mode of Trm7–Trm734. (A) Surface model of Trm7–Trm734 colored according to the electrostatic potential represented as a gradient from negative (red) to positive (blue). Saccharomyces cerevisiae tRNAPhe is placed along the distribution of positively charged surface of Trm7–Trm734–SAM. A line diagram of S. cerevisiae tRNAPhe is colored orange. The D-arm of S. cerevisiae tRNAPhe is colored black. (B) Close-up view of the placement in panel A. The D-arm of S. cerevisiae tRNAPhe is colored black. Cm32, G34, m1G37 and SAM are indicated by the red dotted circles and black line with labels, respectively.
