Figure 3.
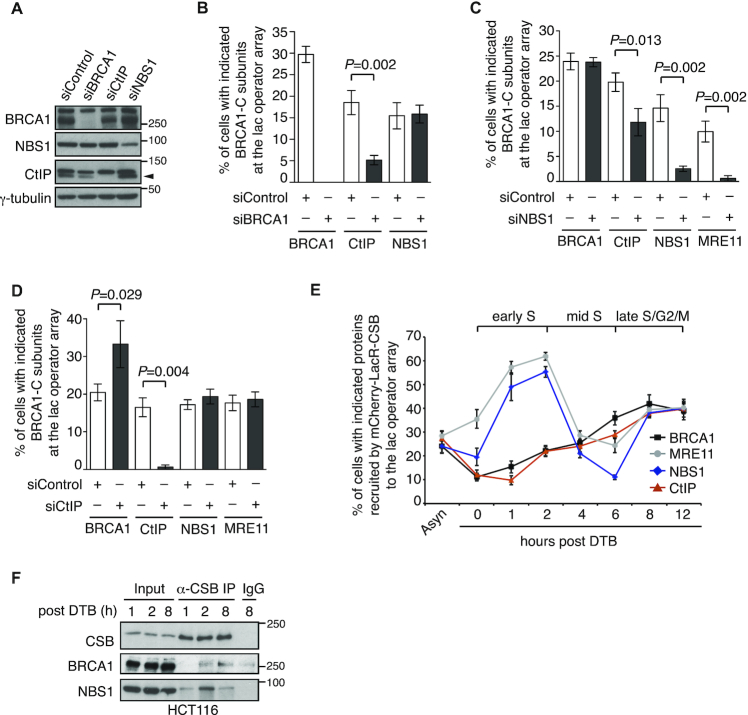
CSB interacts with MRN and BRCA1 in a cell cycle regulated manner. (A) Western analysis of U2OS-265 CSB-KO cells expressing various siRNAs as indicated. The γ-tubulin blot was used as a loading control in this and subsequent figures. The arrowhead indicates the CtIP protein band. (B) Quantification of the percentage of siControl- and siBRCA1-expressing cells exhibiting BRCA1, CtIP and NBS1 at the lac operator array. At least 100 mCherry-positive cells was scored per condition in a blind manner in this panel, 3C and 3D. Standard deviations from three independent experiments are indicated in this and subsequent panels. (C) Quantification of the percentage of siControl- and siNBS1-cells exhibiting BRCA1, CtIP, NBS1 and MRE11 at the lac operator array. (D) Quantification of the percentage of siControl- and siCtIP-cells exhibiting BRCA1, CtIP, NBS1 and MRE11 at the lac operator array. (E) Quantification of the percentage of synchronized mCherry-LacR-CSB-expressing U2OS-265 cells exhibiting indicated proteins at the lac operator array. At least 200 mCherry-positive cells were scored per condition in a blind manner. Asyn: asynchronous; DTB: double thymidine block. (F) Anti-CSB coIPs of synchronized HCT116 cells.

