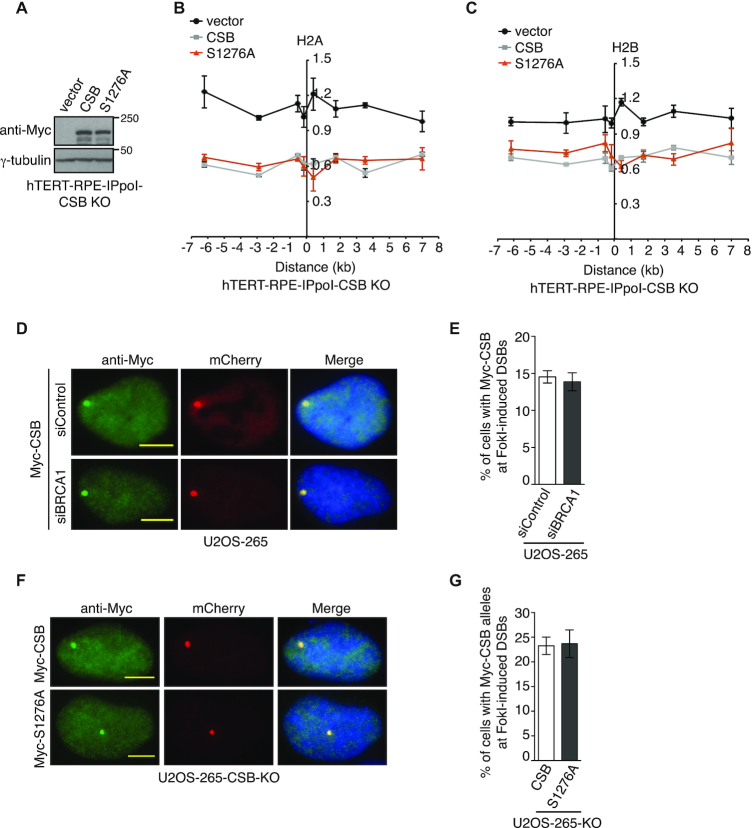
Figure 6.
CSB phosphorylation on S1276 is dispensable for its own recruitment and histone eviction at DSBs. (A) Western analysis of ddI-PpoI-expressing hTERT-RPE CSB-KO cells stably expressing various Myc-CSB alleles as indicated. (B) Relative occupancy of histone H2A in ddI-PpoI-expressing hTERT-RPE CSB-KO cells stably expressing various Myc-CSB alleles as indicated. The x-axis represents the distance in kb upstream and downstream from the I-PpoI-induced DSB on chromosome 1, which was set as 0. The y-axis represents the relative occupancy of H2A of cells 2 h post induction of I-PpoI relative to uninduced cells. Standard error of the mean (SEM) from three independent experiments are indicated in this panel and 6C. (C) Relative occupancy of histone H2B in ddI-PpoI-expressing hTERT-RPE CSB-KO cells stably expressing the vector alone, Myc-CSB or Myc-CSB-S1276A. Both x-axis and y-axis are as described in 6B. (D) Representative images of cells with induction of FokI expression. U2OS-265 cells were transfected with siControl or siBRCA1 and 24 h later with Myc-CSB. (E) Quantification of cells exhibiting Myc-CSB at FokI-induced DSBs from (D). At total of 250 cells positive for Myc-CSB expression were scored per condition in a blind manner. Standard deviations from three independent experiments are indicated in this panel and 6F. (F) Representative images of Myc-CSB and Myc-CSB-S1276A-expressing U2OS-265-CSB-KO cells with induction of FokI expression. (G) Quantification of cells exhibiting Myc-CSB alleles at FokI-induced DSBs from (F). Scoring was done as in 6E.

