Figure 2.
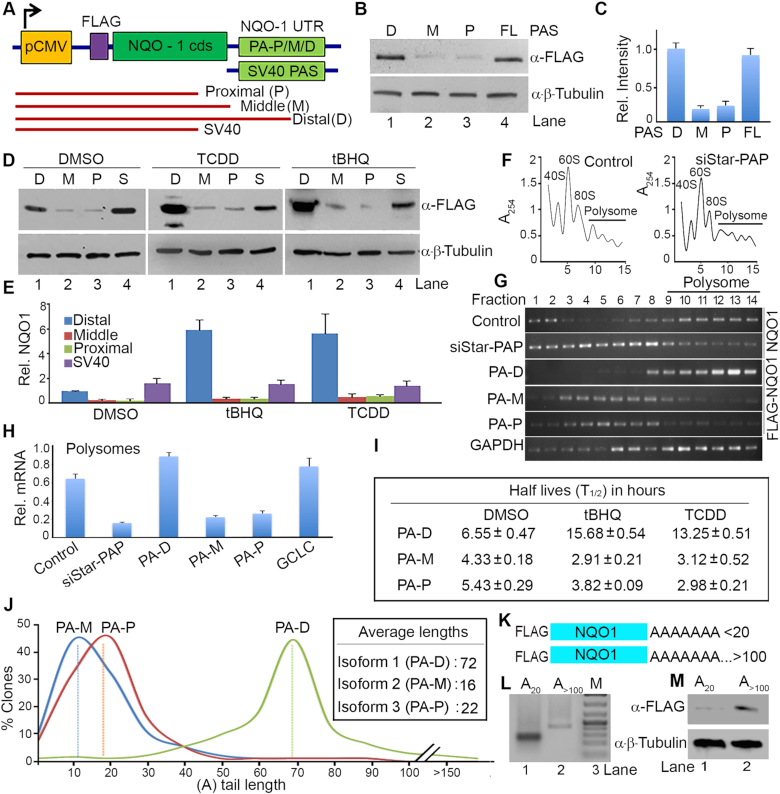
NQO1 APA generates mRNA isoforms with different translation efficiencies that is linked with differential PA-tail length addition. (A) Schematic of a reporter mini gene construct of FLAG-NQO1 expressed from the CMV promoter and driven by each NQO1 PA-site (P-proximal, M-middle, and D-distal) or control SV40 3′-UTR. Sequences of respective 3′-UTRs are shown in Supplementary Figure S1. Red lines represent FLAG-NQO1 mRNA isoforms generated from the proximal, middle, or distal PA-site specific reporter constructs. (B, C) Western blot analysis and quantification of FLAG-NQO1 from HEK 293 cells after transfection of the three FLAG-NQO1 mini-gene reporter constructs. Quantification of band intensity was performed by using Image J software and is shown in C. Intensities (in arbitrary units) for each band was normalized with β-tubulin and expressed as fold difference in relative intensity with respect to the control DMSO treated sample. Error bar represents SEM of n = 3 independent experiments. (D, E) Western blot analysis and quantification of FLAG NQO1 after transfection of different FLAG-NQO1 reporter mini-gene constructs driven by the three PA-sites (distal-D, middle-M, proximal-P) in the presence and absence of tBHQ (100 μM for 4 h) or TCDD (100 nM for 24 h) treatment as indicated. Quantification of the blot is shown in E. Intensities (in arbitrary units) for each band was normalized with β-tubulin and expressed as fold-difference in relative intensity with respect to the distal-site DMSO treated sample. Error bar represents SEM of n = 3 independent experiments. (F) Representative polysome profile of HEK 293 cells in the presence and absence of Star-PAP knockdown after fractionation with 10–50% sucrose density gradient of 15 fractions. Ribosomal RNA content measured at 254 nm was plotted against fraction numbers. The top of the gradient is on the left, peaks representing monosomal fractions, and polysomal fractions are indicated. (G) RNA isolated from each fraction from the density gradient was analyzed for polysomal association of FLAG-NQO1 (transfected reporter NQO1), endogenous NQO1, and GAPDH mRNA (from control sample) by semi-quantitative RT-PCR. (H) qRT-PCR analysis endogenous NQO1 mRNA or FLAG-NQO1 mRNA in the combined polysomic fractions of the density gradient (9–14 fractions). NQO1 or control GCLC mRNA levels normalized to GAPDH are expressed relative (percent) of total mRNA. Error bar represents SEM of n = 3 independent experiments (P-values: 0.003, 0.01, 0.008, 0.03, 0.02, and 0.006 for control, siStar-PAP, PA-D, PA-M, PA-P, and GCLC respectively). (I) Half-life (T ) measurement of each NQO1 isoform encoded by proximal (P), middle (M) or distal (D) PA-sites after transcription inhibition with actinomycin D under conditions as indicated. T
 is expressed in hours. Data are mean ± SEM of n = 3 independent experiments. (J) PA-tail length distribution of NQO1 mRNA isoforms encoded by distal, middle or proximal PA-sites (sequenced from >200 clone each), and average PA-tail length is indicated in the inset. (K) Schematics of the RNA template for in vitro translation generated from distal PA-site with short A (A16) and long A (>A100, after polyadenylation of the A16NQO1 template). (L) Agarose gel analysis of both short and long A NQO1 RNA templates as in K. (M) In vitro translation using HeLa cytoplasmic lysates with in vitro transcribed NQO1 RNA template generated from the distal PA-site with short A (A16) and long A (>A100, after polyadenylation of the A16NQO1 template).

