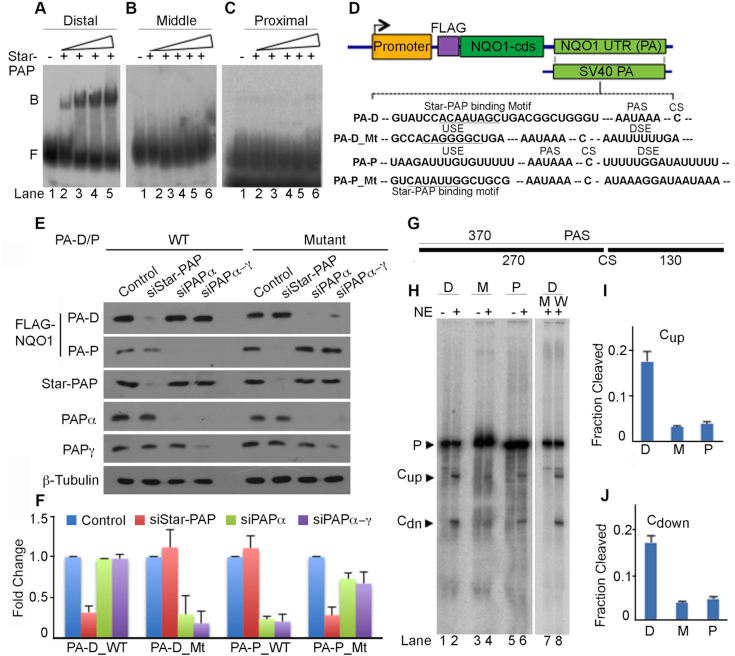
Figure 3.
Star-PAP specifically selects the distal PA-site at the NQO1 3′-UTR and is processed more efficiently. (A–C) RNA EMSA using 3′-UTR fragments with each NQO1 PA-site and recombinant His-Star-PAP. Binary complex, B and Free probe, F are indicated. (D) Schematic of NQO1 reporter constructs and mutations introduced on the distal (PA-D) and proximal (PA-P) sites as indicated. Sequence of PA sites and mutations are indicated in the Supplementary Figure S1. (E) Western blot analysis of FLAG-NQO1 expressed from reporter constructs driven by distal (PA-D) and proximal (PA-P) PA-sites where mutations were introduced at the downstream and upstream sequences relative to respective PA-sites as indicated. Each blot is representative of n = 3 independent experiments. (F) qRT-PCR analysis of reporter FLAG-NQO1 under the condition as in E. Error bar represents SEM (n = 3) independent experiments (P-value <0.04 for PA-D_WT, <0.02 for PA-D_Mt and PA-P_Mt, <0.01 for PA-P_WT). (G) Schematics of 3′-UTR RNA template for in vitro cleavage template. (H–J) In vitro cleavage assay using respective 3′-UTR fragments with each PA-site (D-distal, M-middle, P-proximal) and PA-signal mutation (W-wild type, M-AAUAAA to AAGTAC mutation,) of the distal-site 3′-UTR as indicated. Schematic of the template is depicted in G, autoradiogram of the experiment in H, and quantifications in I–J. Quantifications of both pre-mRNA (P) and cleaved (upstream, Cup and downstream, CDn) fragments were carried out using imageJ software and relative intensities (in arbitrary units) for cleaved fragments were expressed as fraction cleavage relative to total intensity of both uncleaved and cleaved fragments. Error bar represents SEM, n = 3 independent experiments. Upstream fragment (Cup) and downstream fragment (CDn) after the cleavage of the template are indicated.

