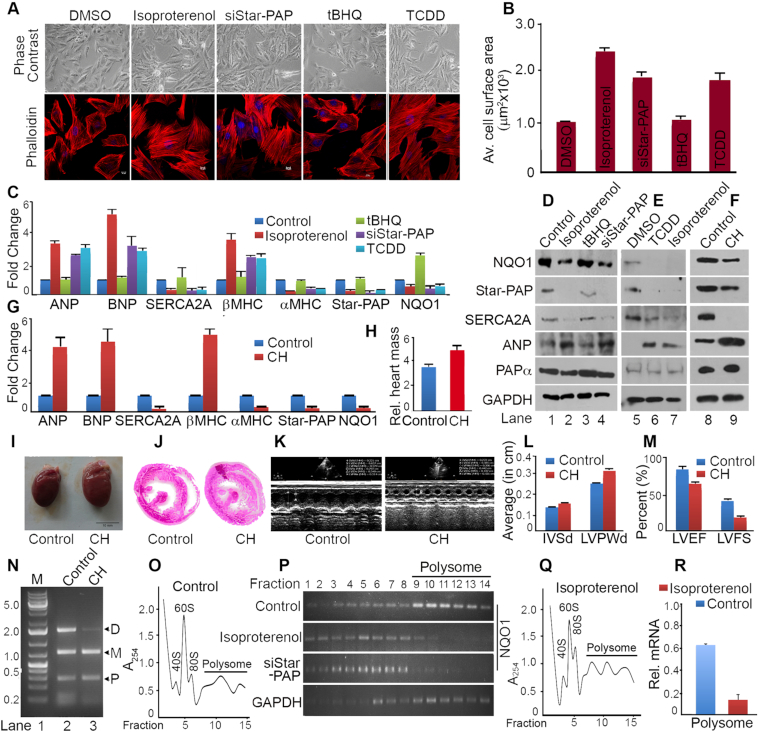
Figure 4.
NQO1 APA is involved in the regulation of cardiac hypertrophy. (A) Phase contrast (PC) and IF imaging of phalloidin stained H9c2 cells after treatment with isoproterenol (100 μM for 48 h), TCDD (10 nM for 48 h), control tBHQ (100 μM for 4 h) or solvent DMSO, and siRNA knockdown of Star-PAP as indicated. (B) Quantification of cell surface area of the phalloidin stained H9c2 cells. Average cell surface area was measured for >50 cells per experiment for n>3 independent experiments (P value = 0.02, 0.04, 0.01, 0.008, 0.03 respectively for DMSO, isoproterenol, tBHQ, siStar-PAP and TCDD treated samples. Error bar represents SEM. (C) qRT-PCR analysis of molecular markers of hypertrophy, NQO1 and Star-PAP after treatment with isoproterenol, TCDD, control tBHQ or solvent DMSO, and siStar-PAP as indicated. mRNA levels are expressed relative to DMSO treated samples (P-values ANP <0.04, BNP <0.025, SERCA2A <0.03, b-MHC <0.04, a-MHC <0.005, Star-PAP <0.01, and NQO1 <0.008). Error bar represents SEM (n = 3 independent experiments). (D, E) Western blot analysis of various hypertrophic markers, Star-PAP, and NQO1 after induced hypertrophy in H9c2 cell line by isoproterenol treatment or TCDD treatment as in C. Each blot is representative of n = 3 independent experiments. (F) Western blot analysis of Star-PAP, NQO1 and hypertrophic markers from control rat heart and isoproterenol induced hypertrophic rat heart (n = 5 independent animals). (G) qRT-PCR analysis of corresponding mRNA expressions as in F from control and hypertrophic animal hearts (n = 5 independent animals in each group). mRNA levels in hypertrophic heart are expressed relative to control animals (P-values: ANP - 0.005, BNP - 0.04, SERCA2A - 0.03, β-MHC - 0.01, α-MHC - 0.009, Star-PAP - 0.04, and NQO1 - 0.02). Error bar represents SEM. (H) Comparison of relative heart mass (heart mass in mg over body mass in gm) ratio of control and hypertrophic heart (n = 5 in each group). Error bar represents SEM. (I, J) Comparison of the heart size and the cross section of control versus hypertrophic heart. (K) Echocardiography analysis of control and hypertrophic animal heart. (L) Measurement of interventricular septum diastole (IVSd) and left ventricular posterior wall thickness of control and hypertrophic animals (n = 5 per group; P values <0.01 for control and <0.005 for hypertrophic heart). Error bar represents SEM. (M) Measurement of left ventricular ejection fraction (LVEF %) and left ventricular fraction shortening (LVFS %) of control and hypertrophic animals (n = 5 per group, P value <0.02 for control and <0.04 for hypertrophic heart). Error bar represents SEM. (N) 3′-RACE assay of NQO1 APA from control and hypertrophy samples from isoproterenol induced hypertrophy in H9c2 cells. (O–R) Representative polysome profiles of H9c2 cells with or without isoproterenol treatment after fractionation with 10–50% sucrose density gradient as in Figure 2F. RNA isolated from each fraction was analyzed for the polysomal distribution of NQO1 or control GAPDH mRNA by semi quantitative RT-PCR, and qRT-PCR to measure relative distribution of NQO1 mRNA (% mRNA relative of total NQO1 mRNA) in the combined polysome fractions.

