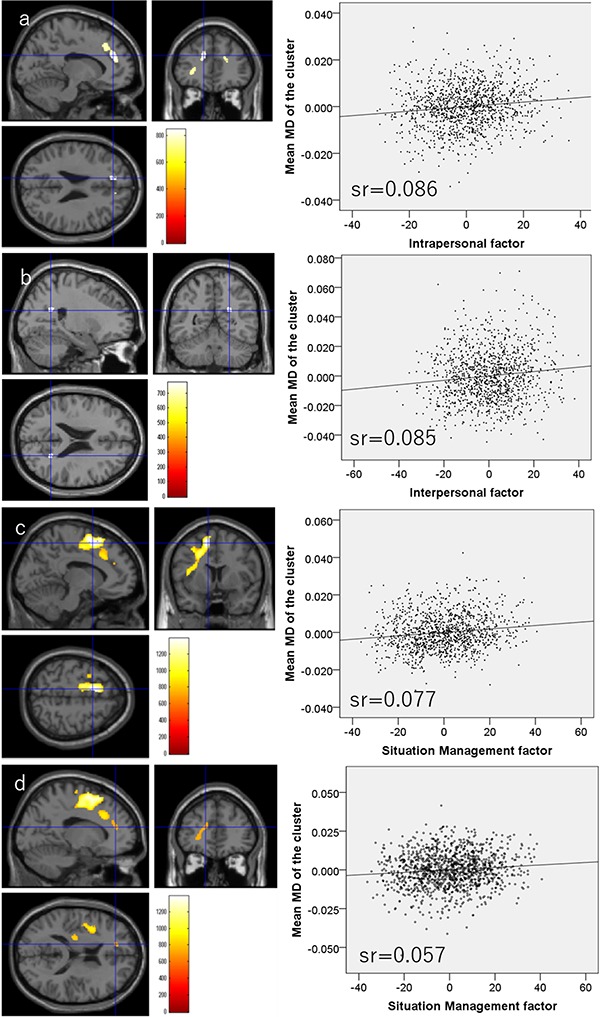
Fig. 3.

Regions showing significant positive correlations between MD and TEI subfactor scores. (Left panels) The results were obtained using a threshold of TFCE (P < 0.05) based on 5000 permutations. Regions with significant correlations are overlaid on a ‘single subject’ T1-weighted image generated by SPM8. The color represents the strength of the TFCE value. (Right panels) The right panels show residual plots with trendlines depicting the correlations between residuals in the multiple regression analyses with mean MD in the significant clusters as the dependent variable and other variables as independent variables. Sr represents semi-partial correlation coefficients. (A) Regions with significant positive correlations between MD and TEI intrapersonal factor scores are mainly distributed around the mPFC, ACC and left inferior frontal gyrus. (B) Regions showing significant positive correlations between MD and TEI interpersonal factor scores were observed in the precuneus. (C) Regions showing significant positive correlations between MD and TEI situation management scores are mainly located around the left ACC, left LPFC and left insula. (D) Regions showing significant positive correlations between MD and TEI situation management scores are also distributed around the left mPFC and left orbitofrontal cortex.
