Figure 2.

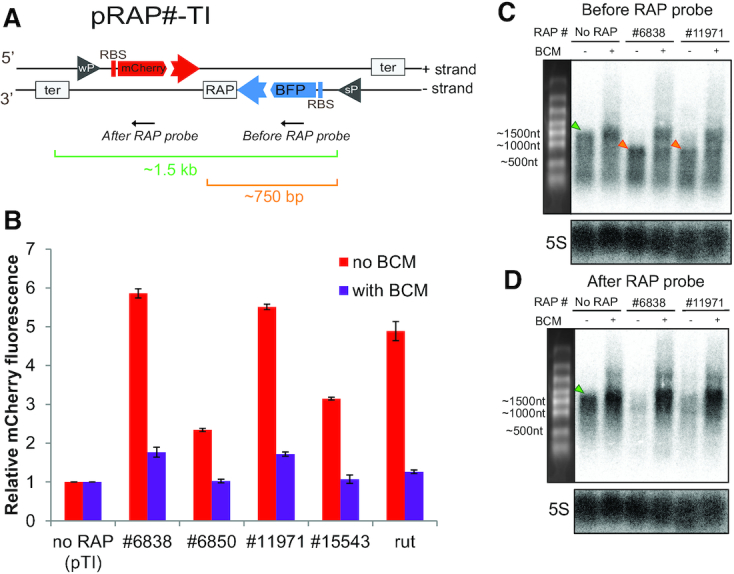
RAPs mitigate TI between convergent genes. (A) Schematic of pRAP#-TI reporter system. ‘wP’ and ‘sP’ inside a grey triangle indicate the location of a weak and a strong promoter, respectively. ‘RBS’ indicates the ribosome-binding site. The ‘RAP’ box indicates the site where RAPs can be cloned. The grey boxes ‘ter’ indicate the terminators of mCherry and BFP transcriptional units. The black arrows indicate the annealing location of the DNA probes used in the northern blot analysis shown in (C) and (D). (B) mCherry fluorescence levels of pRAP#-TI containing different RAPs, indicated here as ‘# and the RAP number’. The levels are relative to the reporter without a RAP sequence cloned after BFP (no RAP). Red bars indicate the mCherry levels when no BCM is added to the culture. Violet bars indicate the mCherry levels when 8 μg/ml BCM is added. All values represented in bars show the mean of measurements from three biological replicates relative to the ‘no RAP’ control. Error bars indicate the standard deviation. BCM treatment caused a statistically significant (P < 0.0001, t test) decrease of mCherry expression in all cases. (C) Northern blot analysis of the transcripts produced from the - strand represented in (A) using the ‘Before RAP probe’. The upper labels indicate the samples used for the analysis. ‘no RAP’ indicates that the RNA comes from pRAP#-TI without any RAP cloned after BFP. ‘#6838′ and #11971 represent RNA coming from pRAP#6838-TI and pRAP#11971-TI, respectively. The ‘BCM’ label indicates which lane contains RNA extracted from cells grown in the presence of 20 μg/ml BCM. The left panel shows the RNA marker bands with their approximate length. The green triangles indicate the full length ∼1500 nt RNA isoform. The orange triangles indicate the ∼750 nt terminated version of the BFP transcript. 5S ribosomal RNA served as a loading control. (D) Northern blot analysis of the transcripts produced from the - strand represented in (A) using the ‘After RAP probe’. The analysis is depicted as in (C).
