. 2019;36(2):63–75. doi: 10.5511/plantbiotechnology.19.0322a

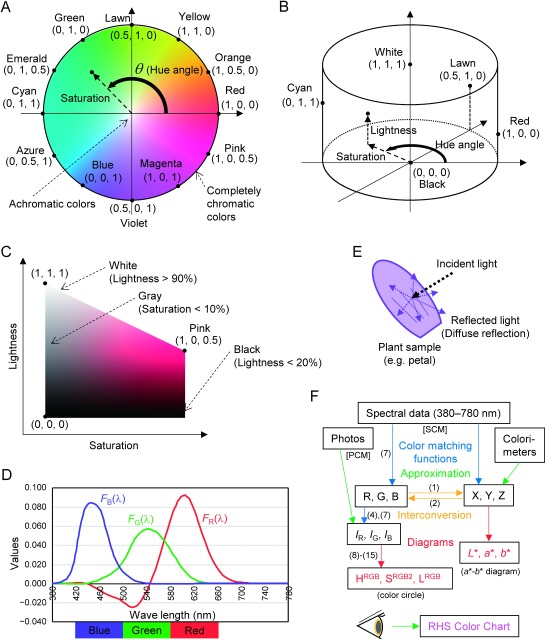
Figure 1. Schematic representation of colorimetric calculations. (A) Color circle. The 12 representative colors are evenly placed on the edge of color circle. Standardized R, G, and B values (IR, IG, and IB) in RGB color system of the 12 colors are in parentheses. Please note that the values of cyanic colors only reflect color angles: fully saturated cyanic colors have more complicated values with negative red values. (B) Color cylinder. Values of red, green, and blue of representative colors are in parentheses. (C) Cut plain of the color cylinder, at pink-hued colors. Values of red, green, and blue, of representative colors are in parentheses. (D) Standardized RGB color matching function. Approximated blue, green, and red color areas are indicated at the bottom. (E) Diffuse reflection on plant surface. (F) Flow of color calculations. Numbers in parentheses represent numbers of formulae in the text. ‘Photos’ represent color data obtained by digital camera, which is the start point of PCM. ‘Spectral data’ represent data acquired by spectrophotometer, which is the start point of SCM.

Figure 1. Schematic representation of colorimetric calculations. (A) Color circle. The 12 representative colors are evenly placed on the edge of color circle. Standardized R, G, and B values (IR, IG, and IB) in RGB color system of the 12 colors are in parentheses. Please note that the values of cyanic colors only reflect color angles: fully saturated cyanic colors have more complicated values with negative red values. (B) Color cylinder. Values of red, green, and blue of representative colors are in parentheses. (C) Cut plain of the color cylinder, at pink-hued colors. Values of red, green, and blue, of representative colors are in parentheses. (D) Standardized RGB color matching function. Approximated blue, green, and red color areas are indicated at the bottom. (E) Diffuse reflection on plant surface. (F) Flow of color calculations. Numbers in parentheses represent numbers of formulae in the text. ‘Photos’ represent color data obtained by digital camera, which is the start point of PCM. ‘Spectral data’ represent data acquired by spectrophotometer, which is the start point of SCM.