. 2019;36(2):63–75. doi: 10.5511/plantbiotechnology.19.0322a

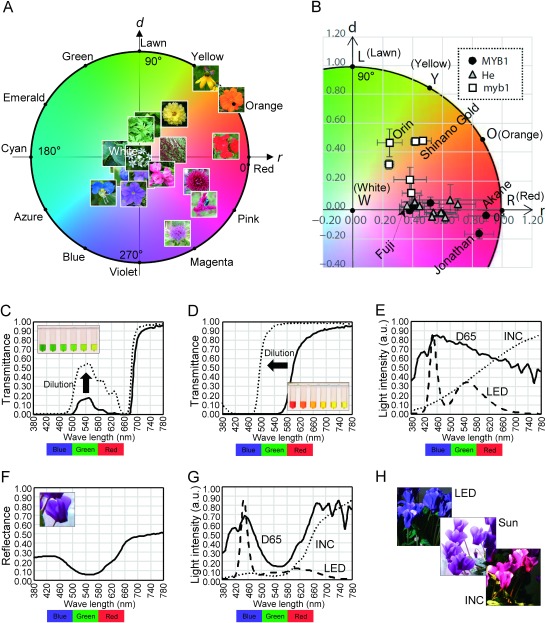
Figure 2. Examples of plant colorimetry. (A) Plot of the plant colors measured in Table 1. Photographs are plotted on round diagram according to their colors. (B) Colors of apple fruits plotted on round diagram (cited from Kikuchi et al. 2017). ‘MYB1’ represents apple cultivars having wild-type MYB1 gene, ‘myb1’ represents cultivars having mutated MYB1 gene, and ‘He’ represents cultivars with heterozygous MYB1 gene. Five representative cultivars are indicated by their names such as ‘Fuji’. Cultivar ‘Jonathan’ is called ‘Kohgyoku’ (red ball) in Japan. (C) Transmittance spectra of a cherry leaf pigment, at different concentrations. Inlet, serial dilution (from left to right) of this pigment. (D) Transmittance spectra of a saffron spice (dried saffron pistil) pigment, at different concentrations. Inlet, serial dilution (from left to right) of this pigment. (E) Spectra of D65, incandescent light (INC), and white LED light (LED). ‘Light intensity’ represents spectral power distribution shown by arbitrary unit. (F) Reflectance spectrum of a purple cyclamen petal. Inlet, photograph of purple cyclamen taken in sunlight. (G) Spectra of the lights reflected on the purple cyclamen petal, under different incident lights D65, incandescent light (INC), or white LED light (LED). ‘Light intensity’ represents spectral power distribution shown by arbitrary unit. (H) The ‘purple’ cyclamen flowers photographed in while LED light (LED), midday sunlight (Sun), or incandescent light (INC).

Figure 2. Examples of plant colorimetry. (A) Plot of the plant colors measured in Table 1. Photographs are plotted on round diagram according to their colors. (B) Colors of apple fruits plotted on round diagram (cited from Kikuchi et al. 2017). ‘MYB1’ represents apple cultivars having wild-type MYB1 gene, ‘myb1’ represents cultivars having mutated MYB1 gene, and ‘He’ represents cultivars with heterozygous MYB1 gene. Five representative cultivars are indicated by their names such as ‘Fuji’. Cultivar ‘Jonathan’ is called ‘Kohgyoku’ (red ball) in Japan. (C) Transmittance spectra of a cherry leaf pigment, at different concentrations. Inlet, serial dilution (from left to right) of this pigment. (D) Transmittance spectra of a saffron spice (dried saffron pistil) pigment, at different concentrations. Inlet, serial dilution (from left to right) of this pigment. (E) Spectra of D65, incandescent light (INC), and white LED light (LED). ‘Light intensity’ represents spectral power distribution shown by arbitrary unit. (F) Reflectance spectrum of a purple cyclamen petal. Inlet, photograph of purple cyclamen taken in sunlight. (G) Spectra of the lights reflected on the purple cyclamen petal, under different incident lights D65, incandescent light (INC), or white LED light (LED). ‘Light intensity’ represents spectral power distribution shown by arbitrary unit. (H) The ‘purple’ cyclamen flowers photographed in while LED light (LED), midday sunlight (Sun), or incandescent light (INC).