. 2019;36(2):99–105. doi: 10.5511/plantbiotechnology.19.0417a

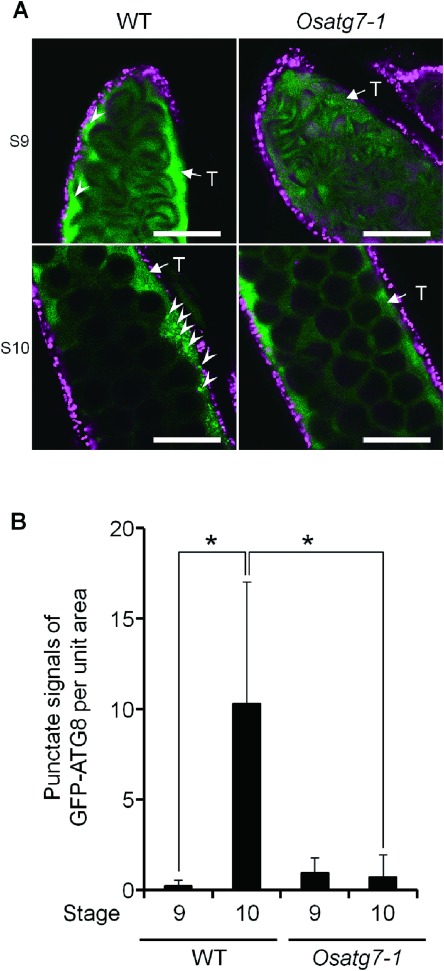
Figure 3. Numbers of autophagosomes/autophagy-related structures in the tapetal cells of the wild-type and the Osatg7-1 mutant. (A) Fluorescence images of the autophagosomes/autophagy-related structures in rice tapetum using a transgenic rice plant stably expressing GFP–AtATG8a under the control of Osg6B/OsC6 promoter. Green and magenta fluorescence indicate GFP and autofluorescence of chlorophyll, respectively. These fluorescence images show one slice containing the tapetal cells obtained by CLSM. Arrowheads indicate punctate signals of GFP–AtATG8a. Scale bars: 50 µm. T, tapetum. (B) Levels of autophagosomes/autophagy-related structures at the uninucleate stages (stage 9 and 10) in the tapetum. To quantify the levels of autophagosome formation, the number of GFP punctate signals (arrowheads) per unit area were counted at the indicated stages. Data are the means±SE of three independent experiments. * p<0.05; significantly different from the wild-type.

Figure 3. Numbers of autophagosomes/autophagy-related structures in the tapetal cells of the wild-type and the Osatg7-1 mutant. (A) Fluorescence images of the autophagosomes/autophagy-related structures in rice tapetum using a transgenic rice plant stably expressing GFP–AtATG8a under the control of Osg6B/OsC6 promoter. Green and magenta fluorescence indicate GFP and autofluorescence of chlorophyll, respectively. These fluorescence images show one slice containing the tapetal cells obtained by CLSM. Arrowheads indicate punctate signals of GFP–AtATG8a. Scale bars: 50 µm. T, tapetum. (B) Levels of autophagosomes/autophagy-related structures at the uninucleate stages (stage 9 and 10) in the tapetum. To quantify the levels of autophagosome formation, the number of GFP punctate signals (arrowheads) per unit area were counted at the indicated stages. Data are the means±SE of three independent experiments. * p<0.05; significantly different from the wild-type.