Figure 4.
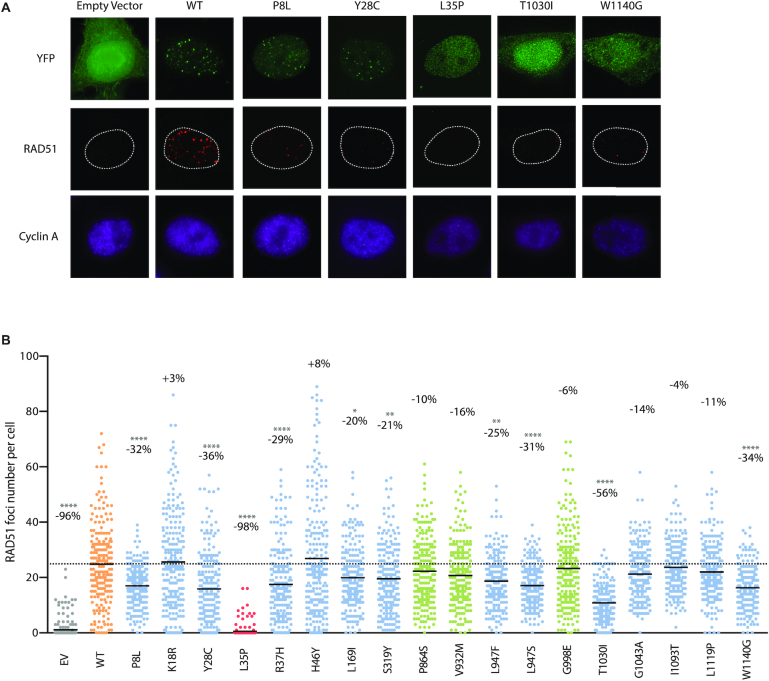
RAD51 foci formation in PALB2 variants. (A) Representative immunofluorescence images of RAD51 foci (red) in PALB2-knockdown HeLa cells complemented with the empty vector or the indicated siRNA-resistant YFP-PALB2 construct (green) and synchronized in S/G2 by double thymidine block, as determined by cyclin A co-staining (purple). Images were acquired from cells fixed 4 h post-ionizing radiation (2 Gy). Variants leading to the strongest phenotypes are shown. (B) RAD51 foci quantification from images in (A) using Volocity software. The scatter dot plot shows the number of RAD51 foci in cyclin A-positive cells expressing the indicated YFP construct, with the horizontal lines designating the mean values of three independent trials (n = 225 cells per condition). The percentage change relative to the WT mean is also indicated for each variant. VUS are depicted in blue, p.L35P pathogenic variant in red, benign/likely benign variants in green, while wild-type PALB2 and the empty vector are highlighted in orange and grey, respectively. Statistical significance was determined by Kruskal–Wallis test with Dunn's multiple comparison post-test. (*) P< 0.05; (**) P < 0.01 and (****) P< 0.0001.

