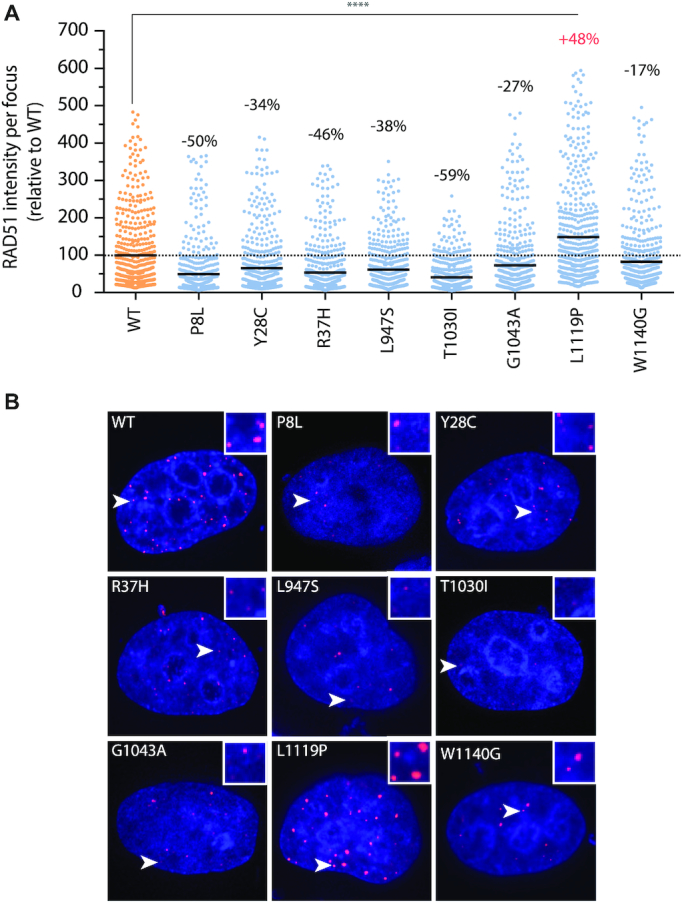
Figure 5.

PALB2 variants showing altered RAD51 foci intensity. (A) Distribution of fluorescent intensities of RAD51 foci as determined using Volocity software. The scatter dot plot shows the intensity values (relative to the WT mean) of 500 RAD51 foci from a representative trial, with the horizontal lines designating the mean values. The percentage change relative to the WT mean is also indicated for each variant. VUS are depicted in blue and wild-type PALB2 in orange. Statistics were performed by Kruskal–Wallis test followed by Dunn's multiple comparison post-test. (****) P< 0.0001. (B) Representative images with enlarged insets of altered RAD51 foci intensity. Merge images of DAPI (blue) and RAD51 (red) staining are shown.
