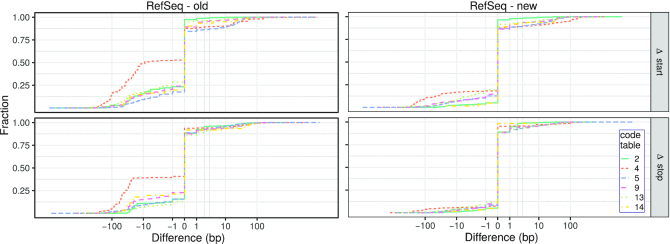
Figure 3.
Cumulative plot of the differences (in base pairs) of the start (Δ start) and stop positions (Δ stop) predicted with the method originally implemented in MITOS (left) and the new method presented here (right) with respect to the reference annotations for those entries that are present in RefSeq 89 but not in RefSeq 63. Positive (negative) values correspond to predictions outside (inside) of the annotation. Differences are shown on an inverse hyperbolic sine scale ( ). For a comparison to RefSeq 63, see Supplementary Figure S8.

