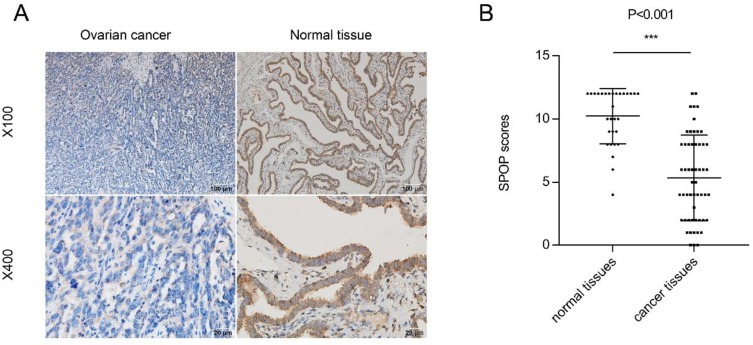
Figure 1.
Expression of SPOP in ovarian cancer and normal tissues. (A) Representative results of SPOP expression in ovarian cancer and normal tissues using immunohistochemical staining (DAB staining; scale bar, 2 mm). High-magnification images providing detailed information are shown at the bottom. (B) SPOP staining intensity was scored in ovarian cancer and normal tissues. SPOP expression was plotted using the immunochemical scores as described in the results. ***P < 0.001.

