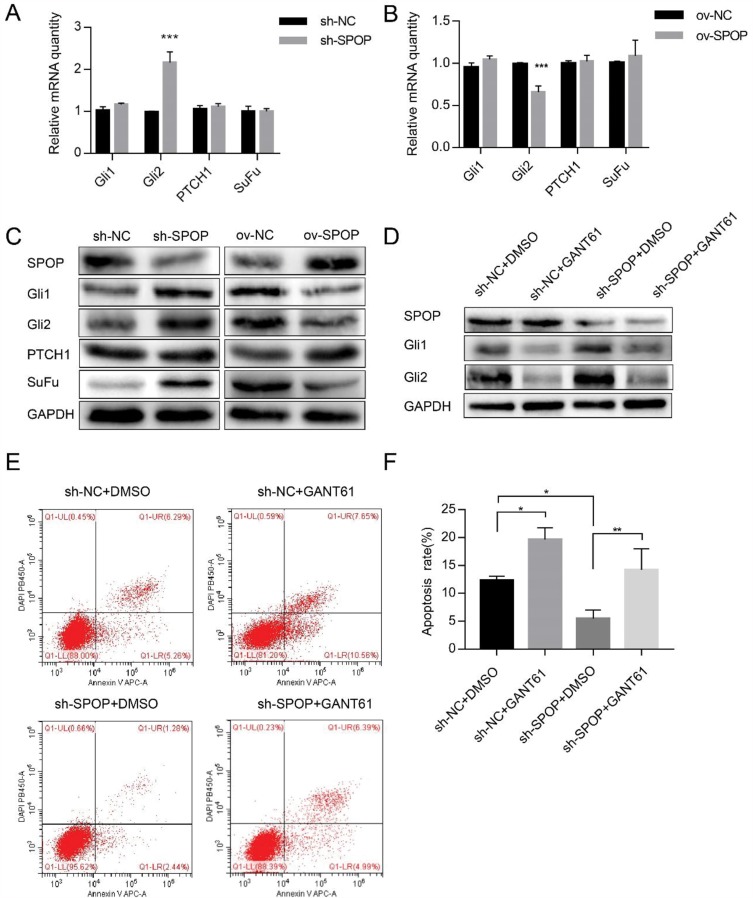
Figure 5.
Effect of SPOP on the apoptosis of OVCAR-3 ovarian cancer cells via the Hh signaling pathway. (A, B) The mRNA expression levels of Gli1, Gli2, PTCH1, and SuFu were determined by qRT-PCR. ***P < 0.001. (C) The protein expression levels of SuFu, PTCH1, Gli1, and Gli2 were determined by Western blotting. (D) The Gli1 and Gli2 protein expression levels in sh-SPOP and sh-NC cells treated with GANT61 (20 μM, 48 h) were determined by Western blotting. The same volume of DMSO was used as a control. (E) Apoptosis was assessed with flow cytometry. (F) The upper and lower right quadrants (late and early apoptotic cells, respectively) of the flow cytometry results were quantitated. Bars represent the standard deviation of three independent experiments. *P < 0.05; **P < 0.01.

