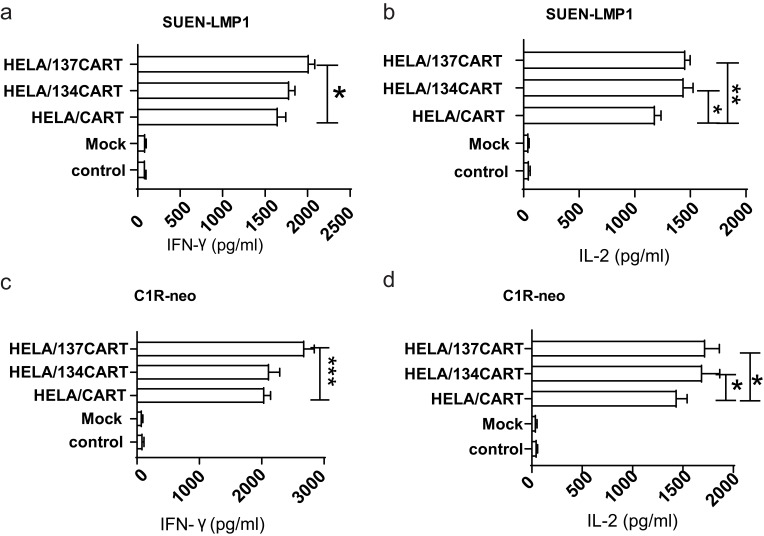
Figure 3.
CART cells produced IFN-γ and IL-2. (A and C) HELA/CAR T cells released significant amounts of IFN-γ when co-cultured with SUNE1-LMP1 and C1R-neo cells. The results are expressed as the mean±SEM and reflect data from three biological replicates. The x-axis indicates the concentration of IFN-γ. (B and D) HELA/CAR T cells released significant amounts of IL-2 when co-cultured with SUNE1-LMP1 cells and C1R-neo cells. The results are expressed as the mean±SEM and reflect data from three biological replicates. The x-axis indicates the concentration of IL-2. *p<0.05; **p<0.01, ***p<0.001.

