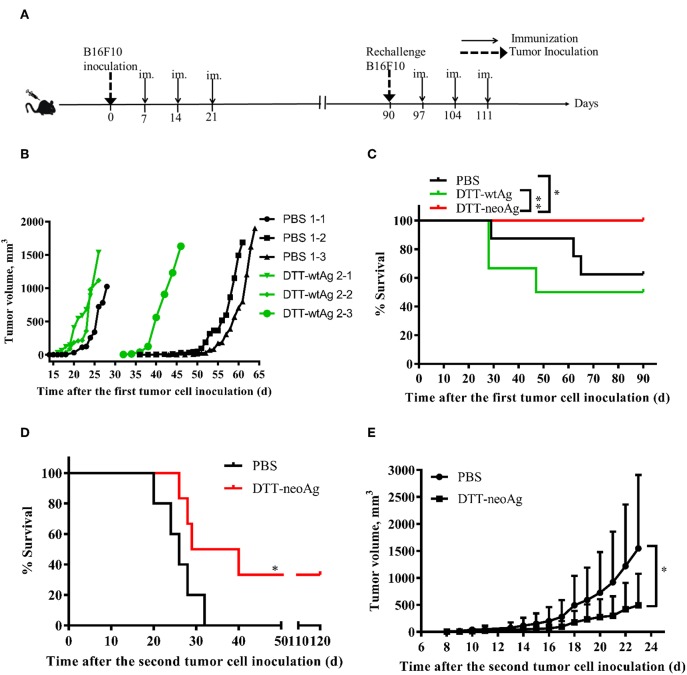
Figure 4.
Anti-tumor effects of DTT-neoAg vaccination in the therapeutic mouse melanoma model. The data are means ± SEM, ****P < 0.0001; ***P < 0.001; **P < 0.01; *P < 0.05, Student's T-test. (A) The treatment schedule. (B,C) C57BL/6 mice (n = 6–13) were s.c. administered with 2.5 × 10⁴ B16F10 cells into the right flank of the mice. Seven days after challenge, mice were immunized with DTT-neoAg, DTT-wtAg, or PBS formulated with Alum + CpG three times at 1-week intervals. (B) The tumor growth curves for individual mouse. Green line: DTT-wtAg-treated mice, and black line: PBS-treated mice. (C) The Kaplan-Meier survival plot. The statistical significance was determined by Log-rank test. *P < 0.05. (D,E) On day 90, the tumor-free mice in PBS-treated group and neoAg-treated group were re-challenged with 7.5 × 10⁴ B16F10 cells in the left flank. One week after the re-challenge, mice were immunized with PBS or neoAg formulated with Alum + CpG for 3 times at weekly intervals. (D) The Kaplan-Meier survival plot. The statistical significance was determined by Log-rank test. *P < 0.05. (E) The tumor growth curves.

