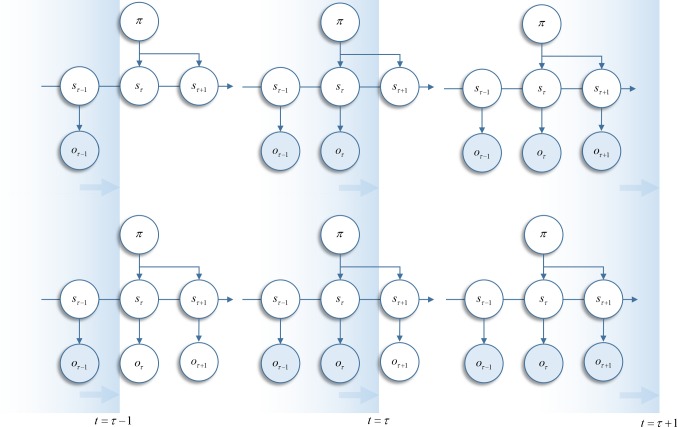
Fig. 2.
Temporal progression of Markov decision process. The upper graphs shows the structure of the generative model implied using the variational free energy, equipped with a prior that the expected free energy will be minimised by policy selection. Observations are added to the model as they occur. The lower graphs show the structure of the generative model that explicitly represents future outcomes, and minimises a generalised free energy through policy selection. As observations are made, the outcome variables collapse to delta functions. These graphics are intended to highlight two alternative conceptions of a generative model employed in an online setting. The key problem here is how to deal with missing (future) outcomes. These could be omitted until such a time as they become available. Alternatively, they could be treated as hidden variables about which we can hold beliefs. Please note that this graphic illustrates different ways of formulating the generative model used to calculate belief updates. It does not show belief updates, behaviour or any other free energy minimising process. These will be detailed in subsequent sections and figures. However, the reason for making this distinction is important for how we formulate the free energy. The key distinction between the free energies compared in this paper is which of the two perspectives on future outcomes we choose to adopt

