Figure 3.
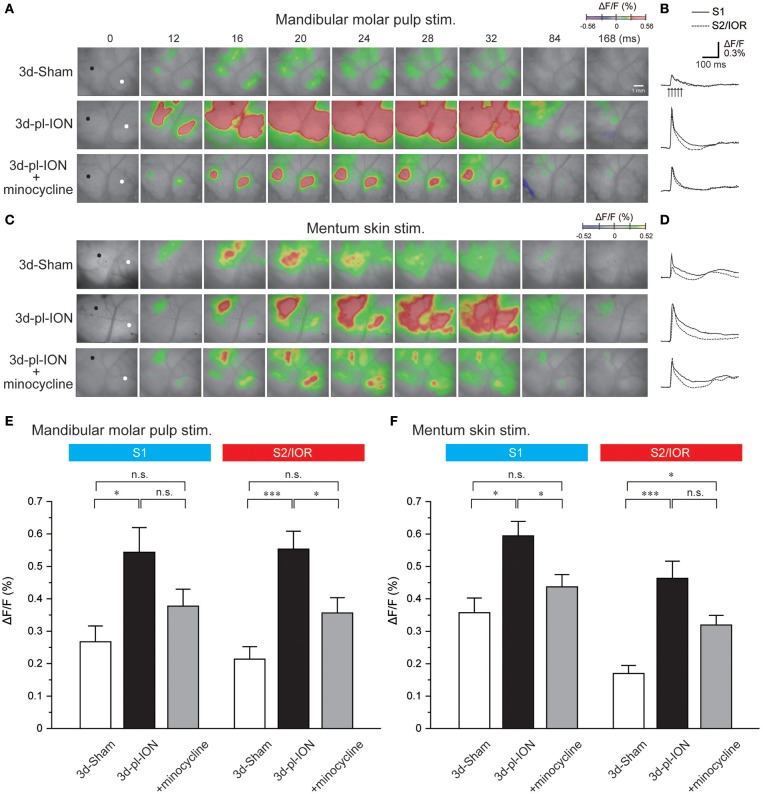
Cortical responses to electrical stimulation of the mandibular molar pulp and mentum skin. (A) Representative examples of cortical responses in 3d-Sham, 3d-pl-ION, and 3d-pl-ION+minocycline to mandibular molar pulp stimulation. The time from the onset of the electrical stimulation of the whisker pad skin is shown on the top of each panel. (B) Temporal profiles of optical signals in the ROIs: black circles in S1 (thick lines) and white circles in S2/IOR (dotted lines) shown in (A). (C) Representative examples of cortical responses in 3d-Sham, 3d-pl-ION, and 3d-pl-ION+minocycline to mentum skin stimulation. (D) Temporal profiles of optical signals in the ROIs: black circles in S1 (thick lines) and white circles in S2/IOR (dotted lines) shown in (C). (E) The amplitude of S1 (blue) and S2/IOR (red) excitation in 3d-Sham (N = 13), 3d-pl-ION (N = 13), and 3d-pl-ION with minocycline (N = 14) in response to stimulation of the mandibular molar pulp. (F) The amplitude of S1 (blue) and S2/IOR (red) excitation in 3d-Sham (N = 7), 3d-pl-ION (N = 15), and 3d-pl-ION with minocycline (N = 15) in response to stimulation of the mentum skin. *P < 0.016, ***P < 0.001, n.s., not significant (Student's t-test with Bonferroni correction).

