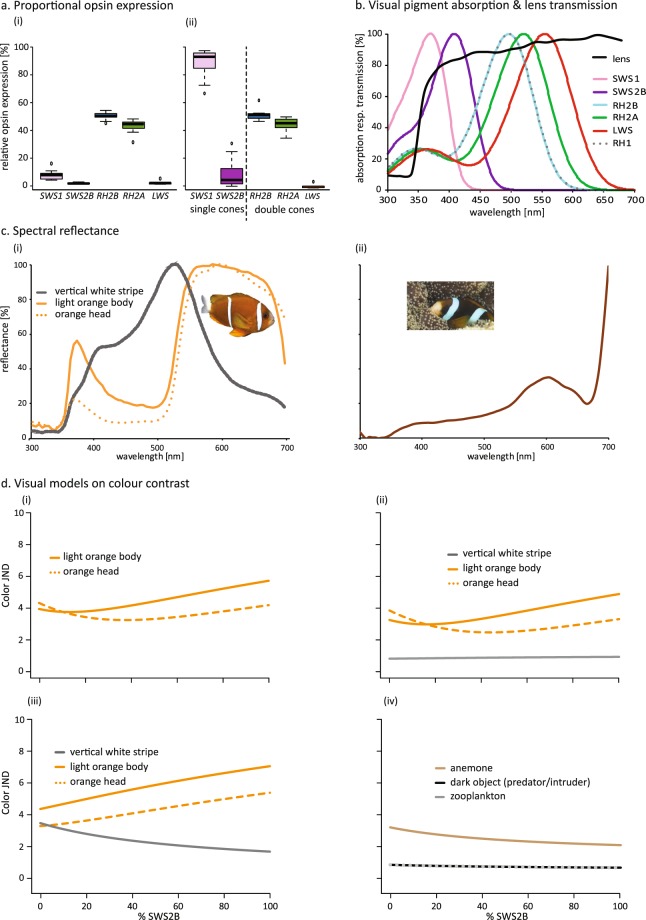
Figure 1.
Relative opsin gene expression (a), visual pigment λmax and lens transmission (b), body and host anemone spectral reflectance (c), and colour contrast modelling (d) in Amphiprion akindynos. (a) Relative expression of cone opsin genes as a fraction of all cones (i), and as a fraction of single (SWS1 and SWS2B) versus double (RH2B, RH2A, and LWS) cones (ii). No difference in opsin gene expression between sex or size were found (Table S2). Hence, plots represent data for all specimens combined (total n = 10; 4 females, 2 males, 4 immatures). The box indicates Q2 and Q3, with the line indicating the median. The whiskers indicate Q1 and Q4 of the data, with dots marking outliers. (c) Idealised spectral absorbance curves for cone visual pigments matched to opsin proteins. λmax for RH1, RH2B, and RH2A was measured using microspectrophotometry, whereas λmax for SWS1, SWS2B and LWS was estimated based on protein structure. Light transmission curve (black line) of the lens showing UV-transmittance (example of a female lens). (c) Normalised spectral reflectance measurements of different body parts of A. akindynos (i), and one of its host anemones (ii). (d) Colour contrast calculated for distinguishing pairs of targets (indicated as just noticable differences, JND) as % SWS2B expression is increased in single cones also expressing SWS1: head orange (450 nm) or body orange (447 nm) versus white stripe (i), fish colours [head orange (446 nm), body orange (444 nm) and white stripe (370 nm)] versus horizontal radiance (ii) fish colours [head orange (449 nm), body orange (447 nm) and white stripe (464 nm)] versus anemone (iii) other targets [anemone (370 nm), dark predator (520 nm) and zooplankton (370 nm)] compared to the horizontal radiance (iv). Number in parentheses indicate the best visual pigment for distinguishing that colour combination based on the peak sensitivity of a visual pigment with a certain %SWS2B.

